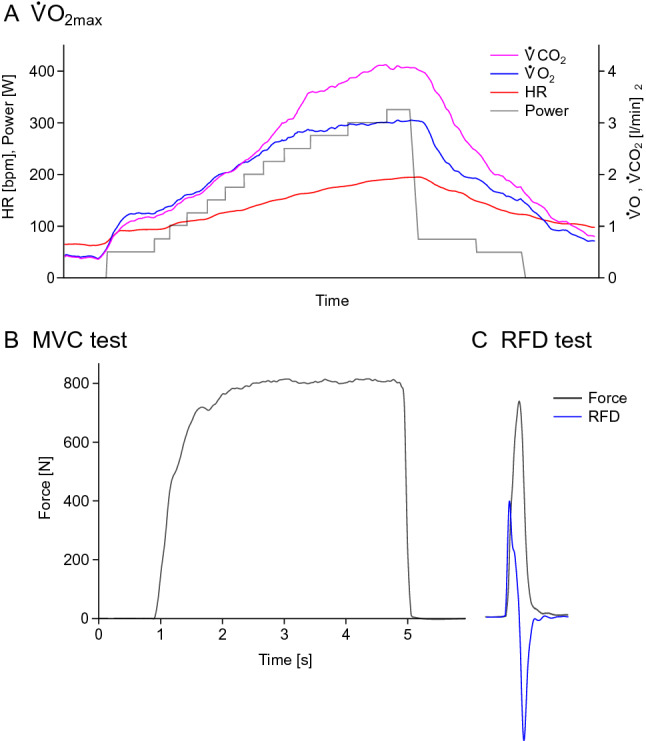
Fig. 3.

Exemplary data. a Data from one V̇O2max step test on the cycle ergometer. Carbon dioxide is shown in pink, oxygen uptake in blue, heart rate in red, and power increments in grey. The test starts with 2 min of seated rest, followed by 3 min of warm-up at 50 W. Afterwards, the load is increased every minute in steps of 25 W until volitional exhaustion occurs (in this example at 325 W), followed by 4 min of active recovery (75 W and 50 W) and 4 min of passive recovery. Note that the figure shows breath-by-breath data, making the steps with higher load appear to be longer due to the increased breathing frequency. b Force data from one maximal contraction (plantar flexion) on the ankle ergometer. c Data from an explosive contraction (plantar flexion), with the force recording shown in grey and the first derivative of the force signal (for RFD calculation) plotted in blue
