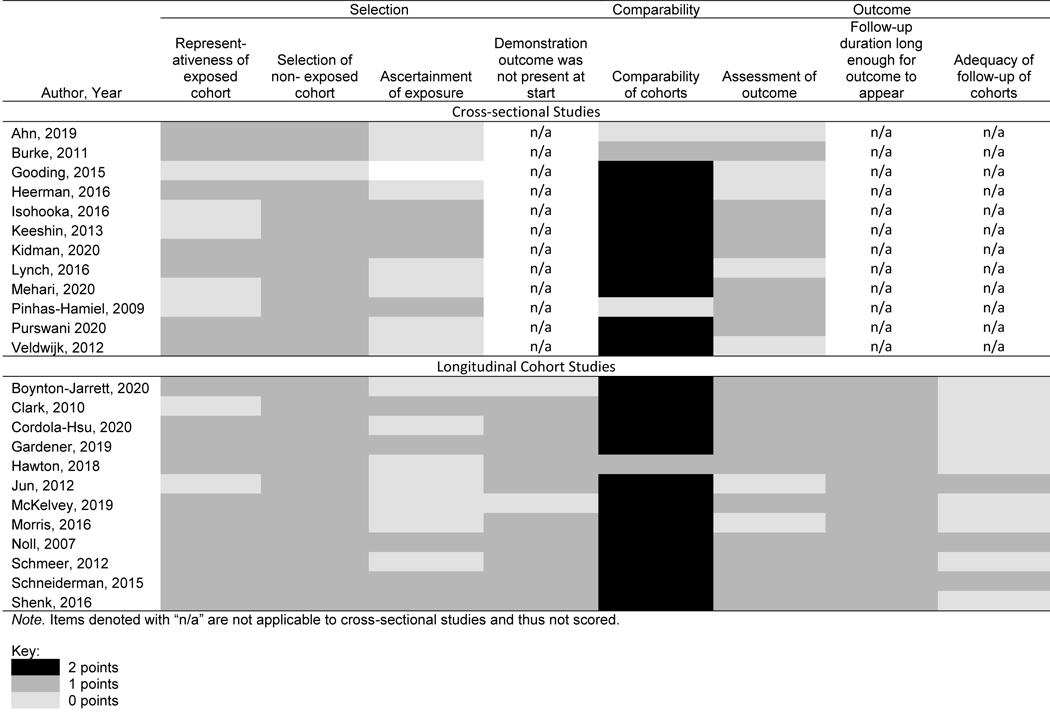
Table 1.
Risk of bias of included cross-sectional and case-control studies, as assessed using Newcastle-Ottawa Scale. Items are scored with 0 points (greater risk of bias) or 1 point (less risk of bias), except ‘comparability of cohorts’ which is scored with 0 (greatest risk of bias), 1, or 2 points (least risk of bias). See key below.
 |
