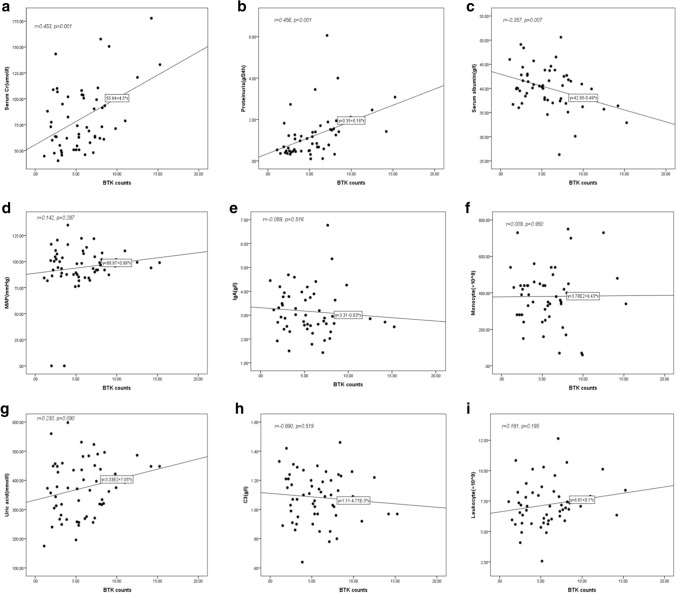
Fig. 11.
Expression of BTK in renal tissues and clinical characteristics of patients with IgAN. a The expression of BTK was positively correlated with Scr (r = 0.453; ***p < 0.001). b The expression of BTK was positively correlated with the levels of 24-h urine protein (r = 0.375; ***p < 0.001). c The expression of BTK was negatively correlated with Alb (r = 0.456; ***p < 0.001). d–i The correlation between BTK expression and MAP, leukocytes, monocytes, UA, serum IgA, and serum C3 (r = 0.142, 0.181, 0.009, 0.230, 0.089, 0.890, respectively; p > 0.05)

