
Figure 1. Micronucleation is an on-target consequence of CRISPR-Cas9 genome editing.
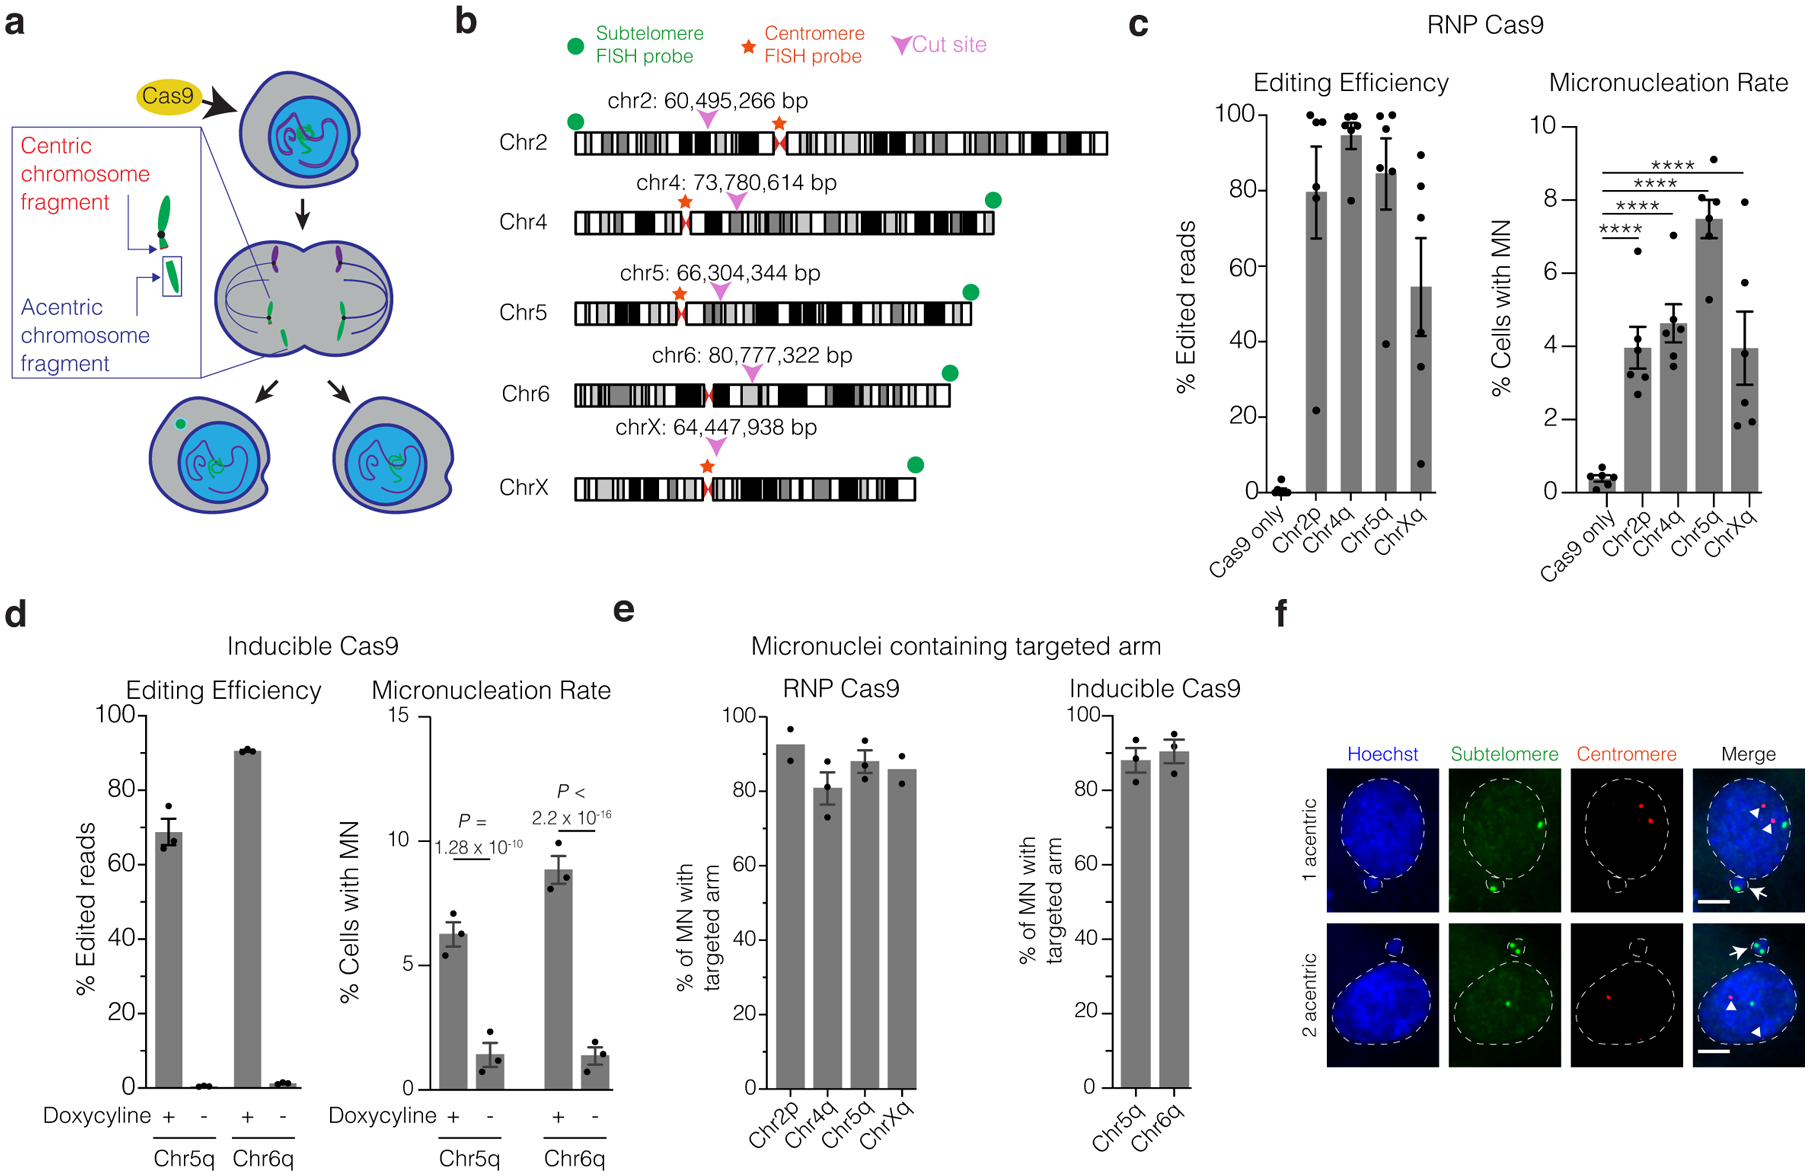
(a) Schematic of how Cas9 DNA cleavage of a chromosome arm can generate micronuclei. In the shown example cleavage of one sister chromatid occurs in during G2. The centric fragment segregates properly into a daughter nucleus whereas the acentric fragment that cannot be segregated by the spindle is partitioned into a micronucleus. Variations on this outcome include cleavage in G1, cleavage of both sisters in a G2 cell, and cleavage of both homologous chromosomes.
(b) Chromosome locations of gRNAs and FISH probes. Magenta arrowheads and numerical coordinates indicate the cut site for specific gRNAs. Green dot: acentric fragment FISH probe locations; red star: centric fragment FISH probe locations.
(c) The frequency of micronucleation after CRISPR-Cas9 RNP transfection in p53-proficient RPE-1 cells. Left, editing efficiency after Cas9/gRNA RNP transfection. Right, frequency of micronucleation for these transfections, 46 h after release of RPE-1 cells from a G1 block. (n = 3 experiments with 5311, 5451, 5144, 4555, 5272 cells scored, left to right). Error bars: mean +/− SEM, **** p < 2.2 × 10⁻¹⁶, two-tailed Fisher’s exact test.
(d) As in panel C, but for doxycycline-inducible CRISPR-Cas9 with constitutively expressed gRNA. p53 siRNA treatment was performed prior to doxycycline treatment. (n = 3 experiments with 1265, 1261, 1244, 1239 cells scored for micronucleation, left to right). Error bars: mean +/− SEM, two-tailed Fisher’s exact test.
(e) Percentage of MN containing the targeted chromosome arm. Left, RNP transfection (n = 2 experiments with 64 and 96 micronuclei scored for chr2p, chrXq, respectively, n = 3 experiments with 83 and 116 micronuclei scored for chr4q, chr5q, respectively). Right, RPE-1 cells with inducible-Cas9 and constitutively expressed gRNA (n = 3 experiments with 168 micronuclei scored for each). Error bars: mean +/− SEM.
(f) Example images of FISH analysis after Cas9/gRNA RNP transfection from data in panel (e) (single plane from a confocal imaging stack). Red: centric fragment probe; green: acentric fragment probe; blue: Hoechst stain (DNA); white arrows: micronuclei; white arrowheads: centromeres; dashed white line: outline of Hoechst (DNA) label. Scale bar 5 μm.