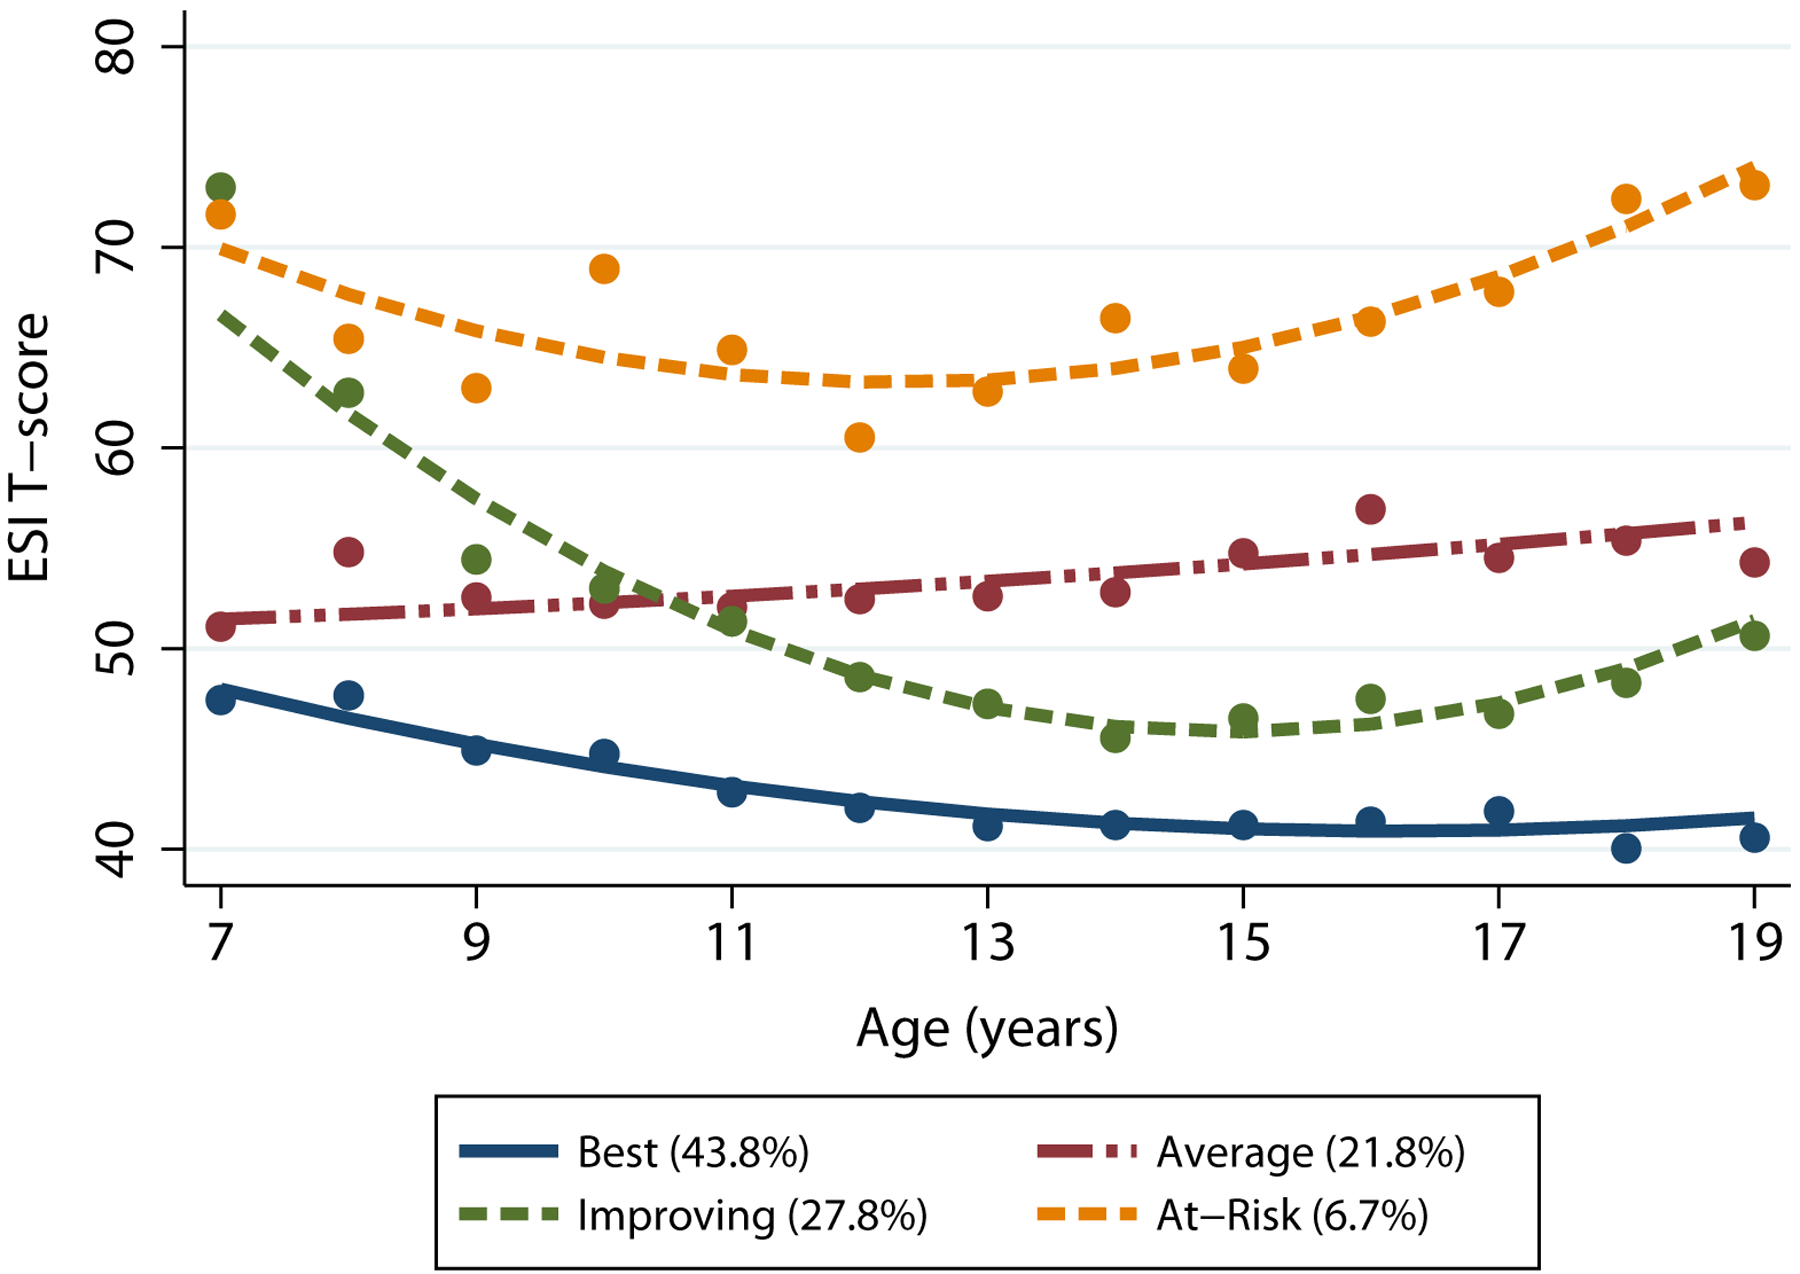
Figure 2a. Group-Based Trajectory Modeling Plot of ESI Trajectories over age.

Higher ESI scores reflect worse emotional functioning (<60: Normal; 60–69: At-Risk, 70+: Clinically Significant). Points represent the observed mean score for each group at each age. Smooth curves represent fitted lines from the GBTM. Mean scores for groups 1 and 2 are considered within normal limits.
