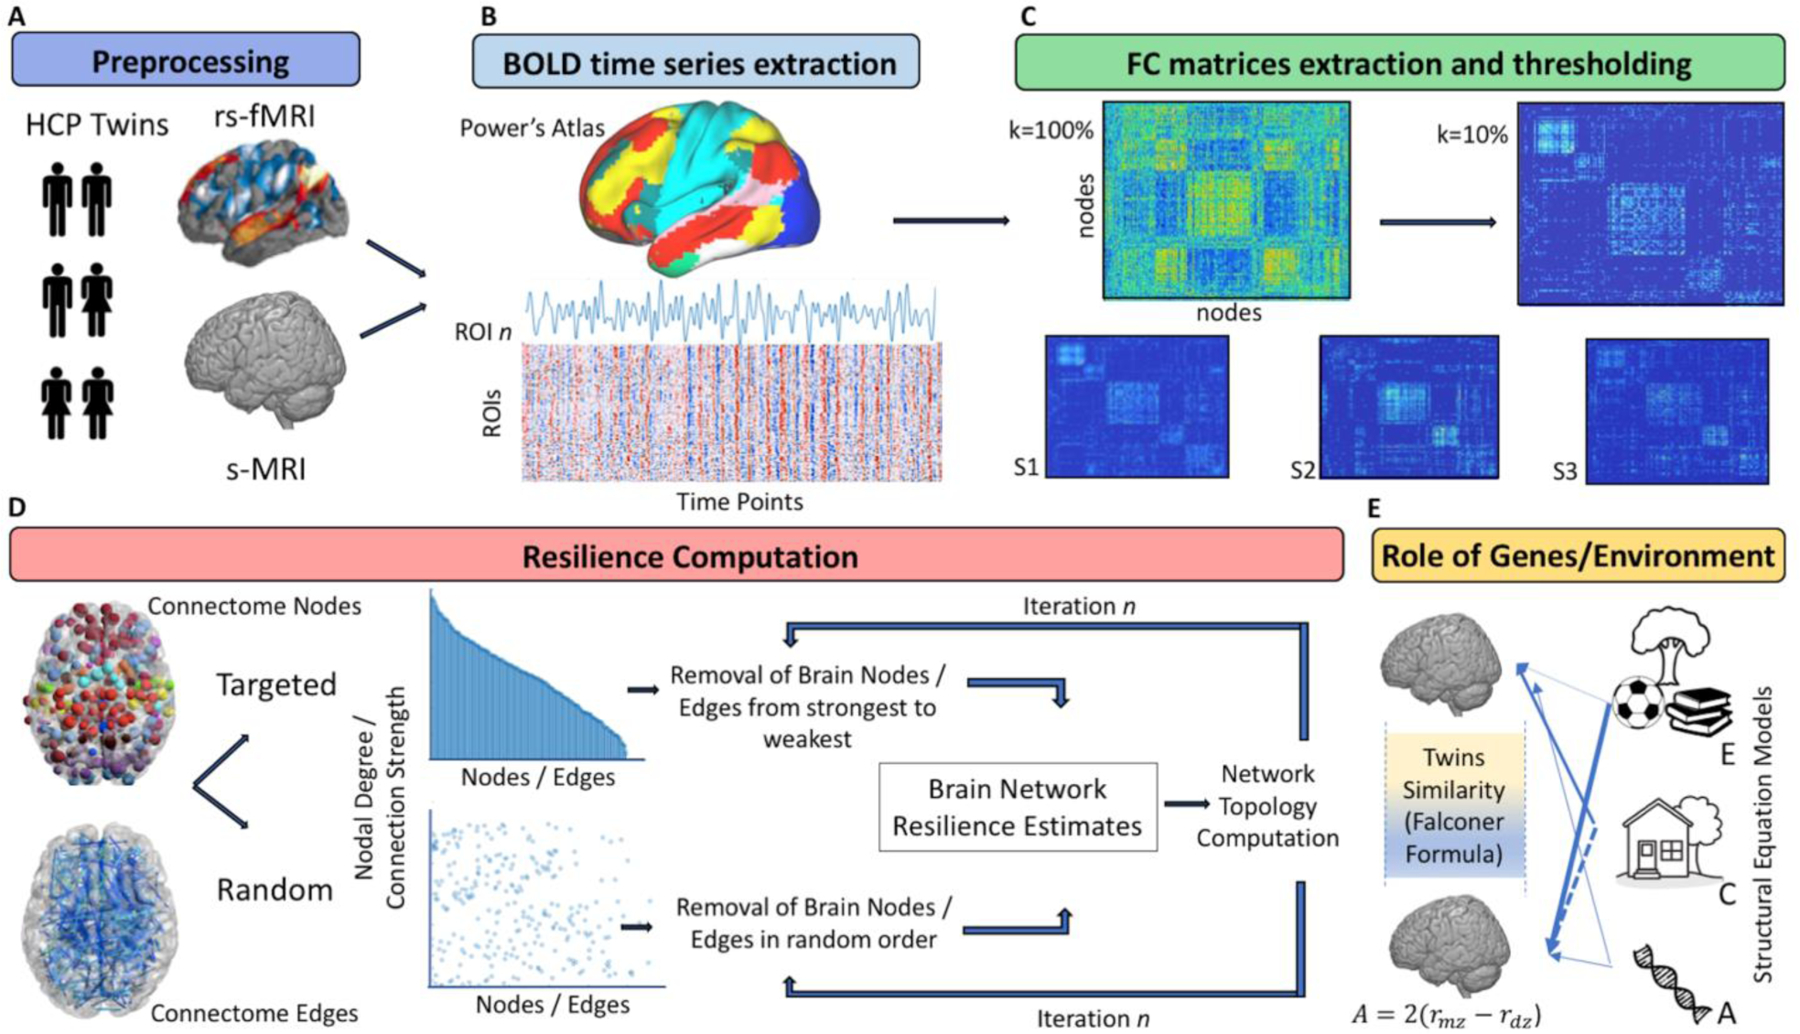
Figure 1. Methodological Workflow.

A. Resting state functional magnetic resonance imaging (rs-fMRI) and structural (s-MRI) data underwent standard preprocessing steps. B. Time series extraction was performed from each of the 264 cortical and subcortical parcels of the Power’s Atlas. C. Functional connectivity matrices were extracted from the Pearson’s r correlation between each pair of ROIs and were normalized through Fischer’s z transformation. Matrices were then thresholded to retain only 10% of the overall connections’ density, from which graph theory measures and brain resilience estimates were computed. D. Resilience measures were extracted following the random and targeted (strongest-to-weakest) removal of nodes and edges from each individual matrix. At each iteration, nodes and edges order of removal was recalculated, and the order of removal adjusted based on the effect of prior lesioning. E. Heritability estimates were computed looking at the phenotypic similarity between each pair of twins (Falconer Formula), as well as by means of structural equation models specifically looking at the influence of genetics (A), unique (E) and common (C) environmental exposure.
