
Figure 3. Critical Point Edges’ Characterization.
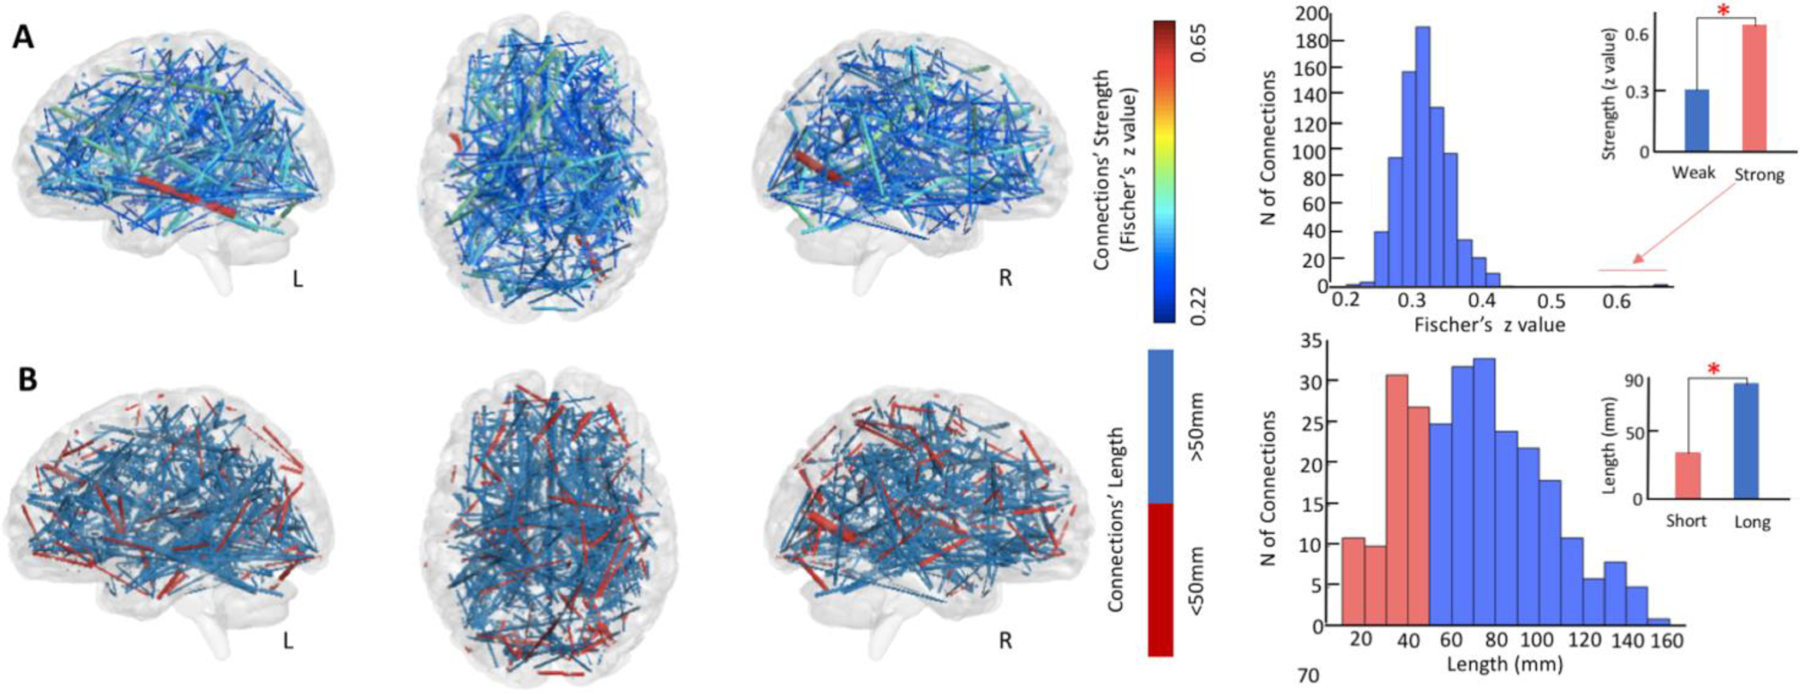
A. Edges accounting for the most heritable trait of resilience, the Critical Point, represent generally weaker ties, with the mean average strength of connections around 0.3 Fischer’s z value. B. From a functional perspective, these edges represent the long-range coupling between distant (>50mm) cortical sites. In panels A and B, the thickness of the edge is representative of its weight, also shown in color-code in panel A (colder colors are indicative of weaker strengths).