
Figure 3.
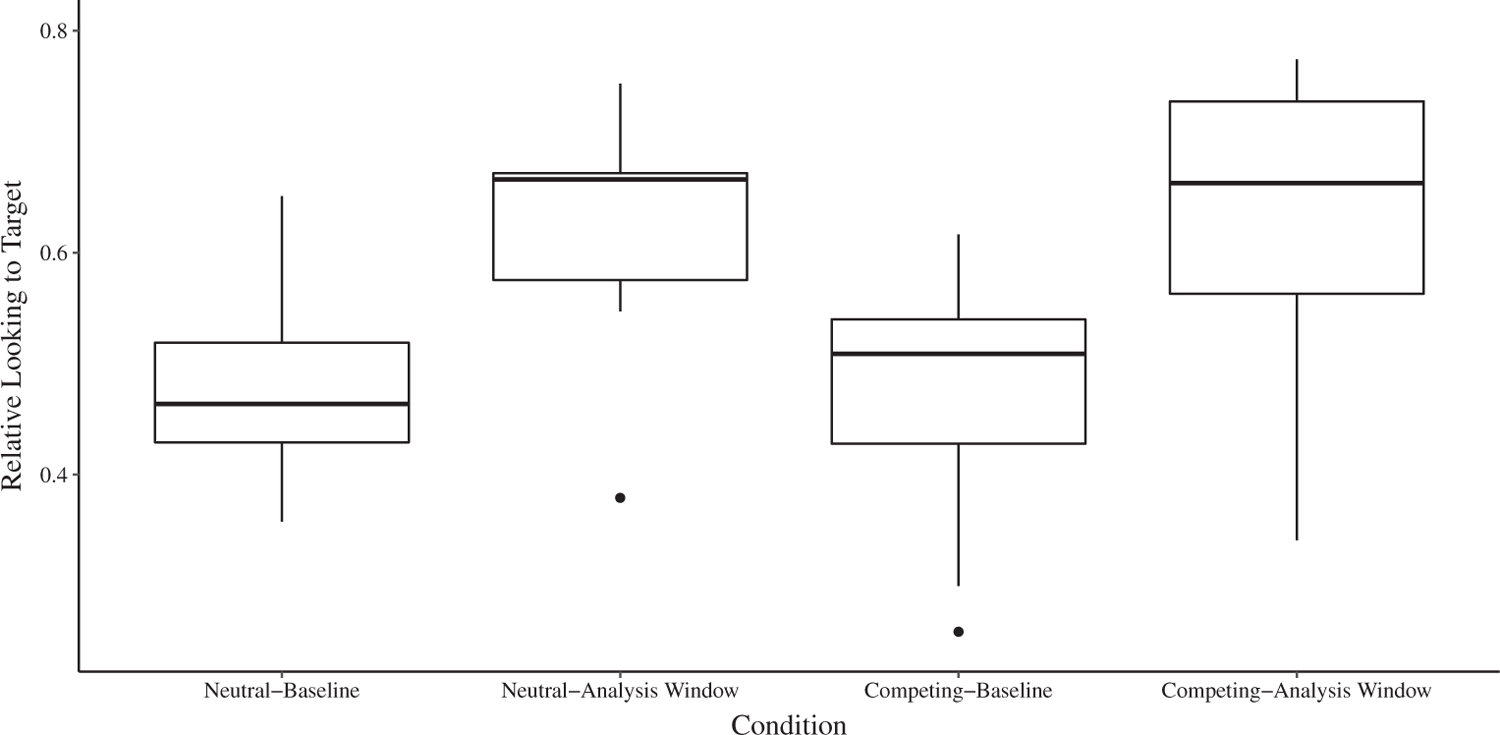
Relative looking to target across the Neutral and Competing Conditions for children with typical development. Baseline was the period before noun onset, and the analysis window was 300–2,000 ms after noun onset. The dark lines represent the median. The upper and lower hinges represent the first and third quartiles (i.e., 25th and 75th percentiles). The whiskers extend to the observed value no more than 1.5 times the distance between the first and third quartiles. Observed values beyond the whiskers are plotted individually.