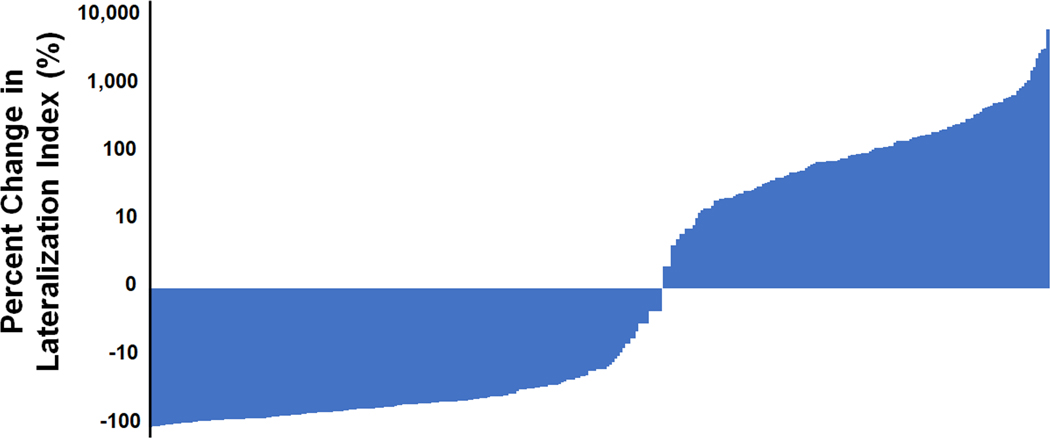
Figure 1. Waterfall plot demonstrating the percent change in lateralization index following ACTH stimulation.
Each individual patient’s change in lateralization index following ACTH stimulation is represented on the x-axis in order of the magnitude of the change. The y-axis represents the log-scale of the percent change in the lateralization index following ACTH stimulation.

