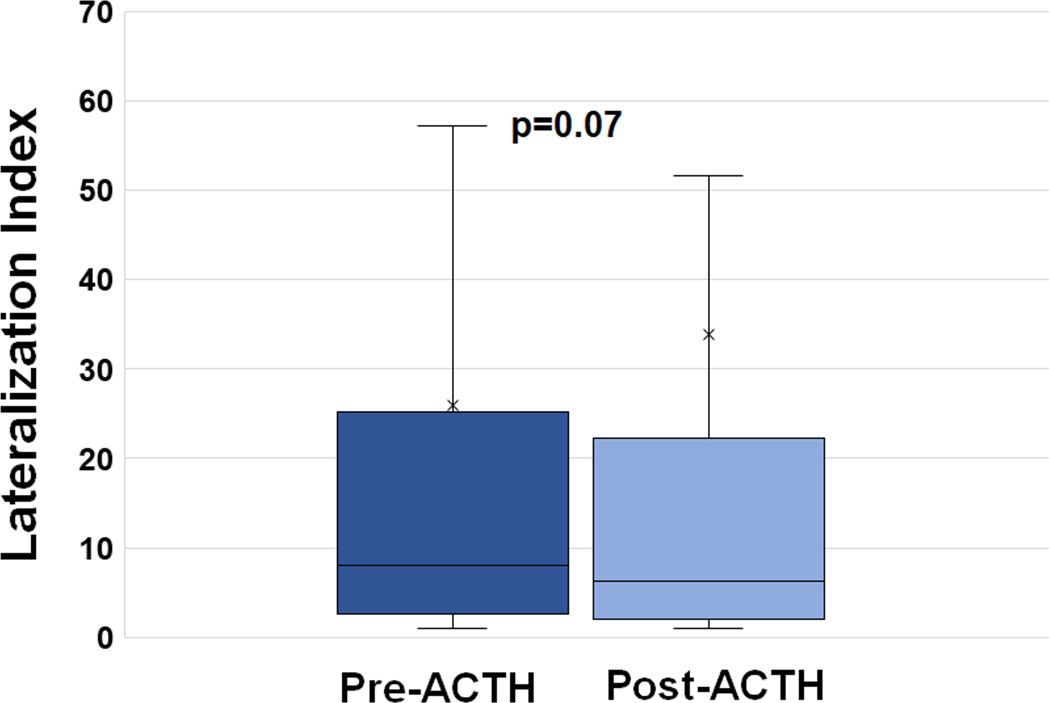
Figure 2. Baseline (pre-ACTH) vs Stimulated (post-ACTH) Lateralization Indices.
Box-and-whisker plot of the average pre-ACTH LI across all 340 patients compared to the average post-ACTH LI across all patients. Medians used for comparison given strongly positive skew, particularly with post-ACTH values.

