
Figure 1. Tak1 Deficiency in Myeloid Lineage Renders Mice Resistance to DSS-induced Colitis and Colon Cancer.
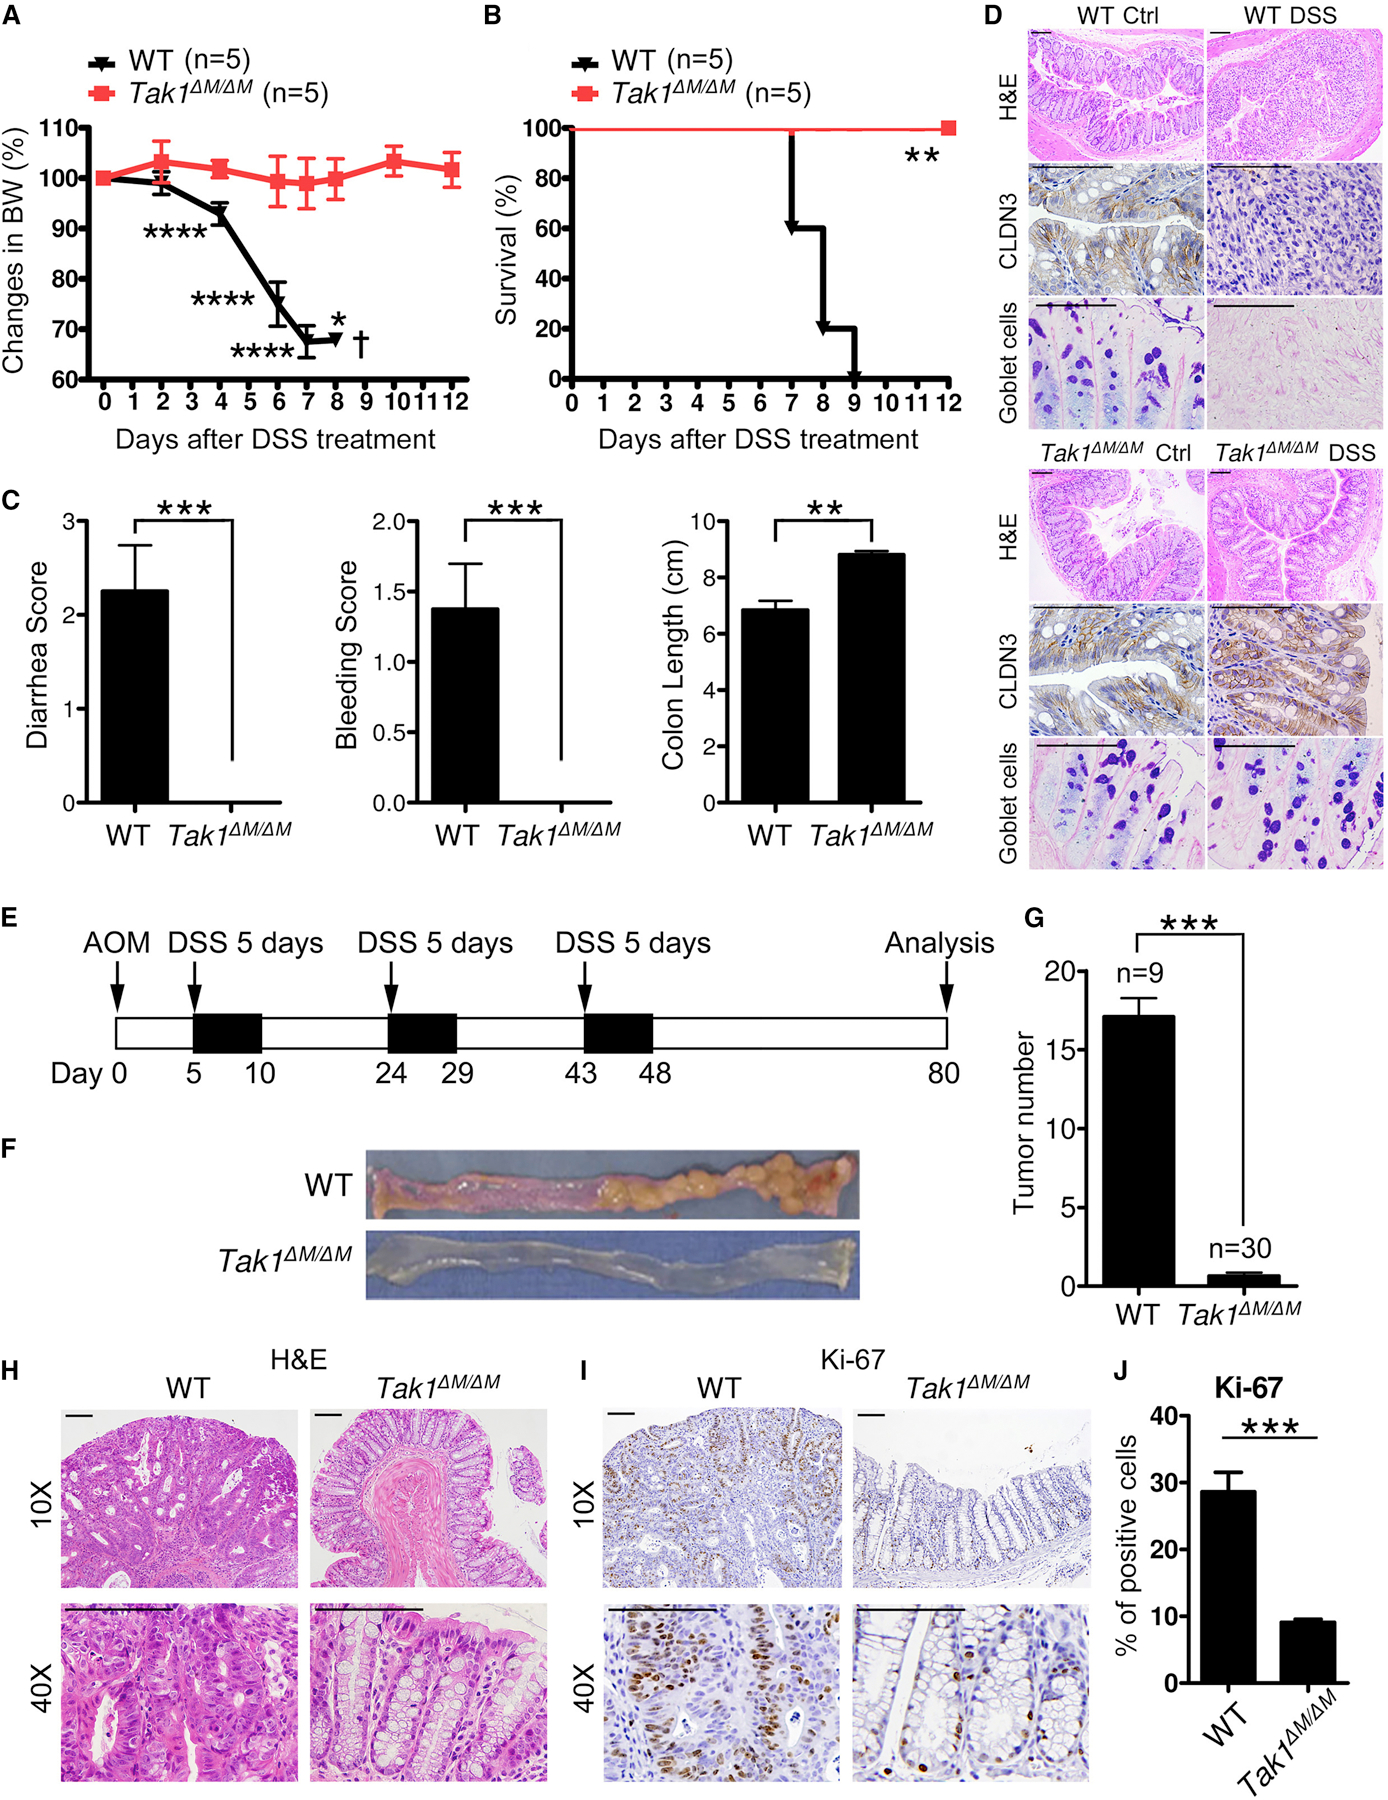
(A-C) Body weight changes, survival, and clinical scores (diarrhea, bleeding, colon length) in WT and Tak1∆M/∆M mice after 5% DSS treatment.
(D) H&E staining (10X), IHC staining of CLDN3 (40X), and AB/PAS staining (40X) on colon sections (day 5 after DSS treatment, scale bar: 100 µm).
(E) Strategy for AOM/DSS-induced colon cancer model.
(F-G) Colon tumors and tumor number analysis in WT and Tak1∆M/∆M mice on day 80 after AOM/DSS treatment.
(H-J) H&E and IHC staining of Ki-67 on colon sections (day 80 after AOM/DSS treatment, scale bar: 100 µm), and the analysis of Ki-67 positive cells.
Statistical analyses: Student’s unpaired t test (A, C, G, and J) and Mantel-Cox log-rank test (B). *p<0.05; **p<0.01; ***p<0.001; ****p<0.0001.
See also Figure S1.