
Figure 6. County-level community water system (CWS) arsenic (μg/L) in 2006-2008, 2009-2011 by high probability private well water arsenic (wAs) > 10 μg/L across the conterminous US.
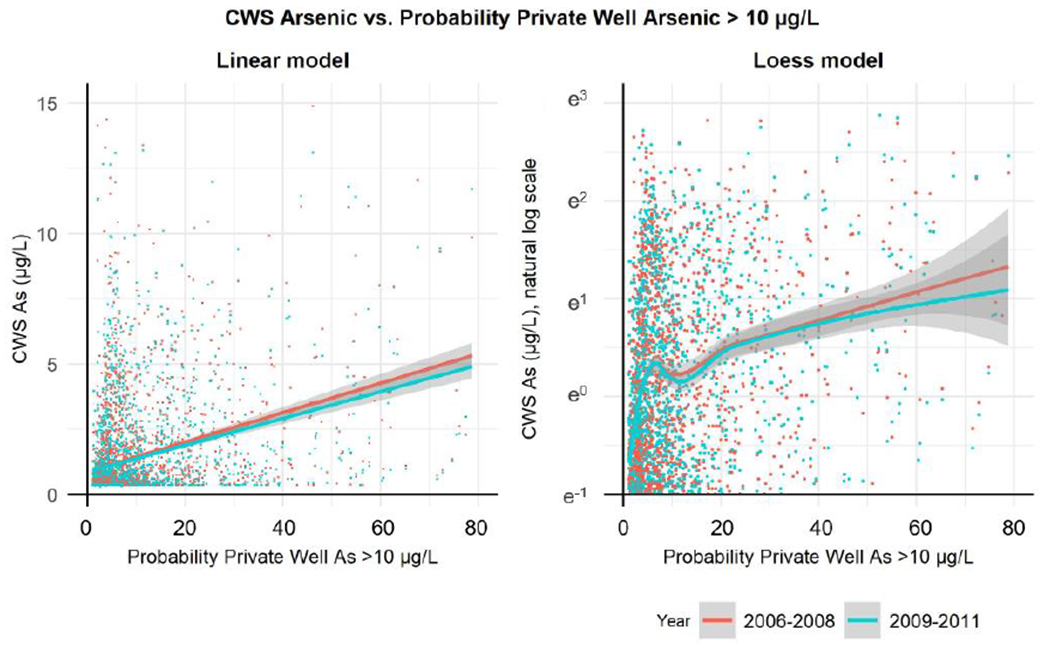
on the original scale using a linear regression model (left), and on the natural log scale using a Loess model (right). Dots represent counties. Lines represent the relationship between private well and CWS arsenic based on linear (left) and loess (right) models. Shades represent 95% confidence intervals.