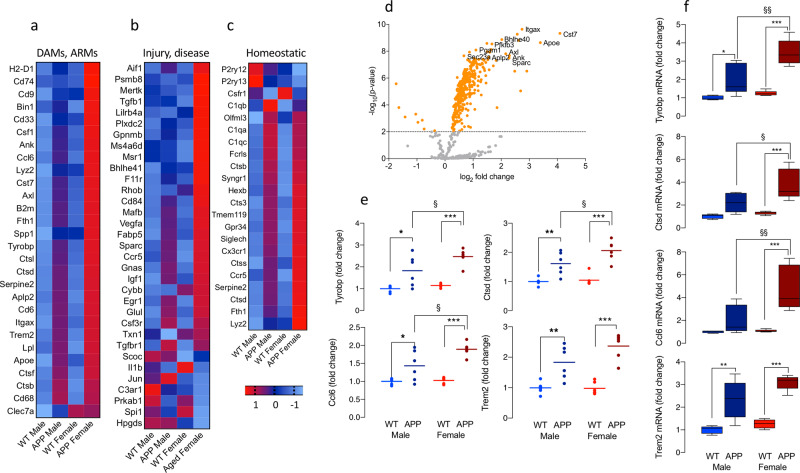
Fig. 1. Sex-related differential expression of microglial markers in APP/PS1 and WT mice.
a–c The heat maps, generated from a Nanostring quantitative assay platform, represent the experimental groups and individual mRNA transcripts in columns and rows, respectively. Genes that have been reported to be upregulated in ARMs and/or DAMs (a) or in other neuroinflammatory conditions (b) and genes that describe the homeostatic state (c), are shown. Expression is displayed on a log 10 scale from blue (low expression) to red (high expression). d Volcano plots of mRNA expression showing significant genotype-related differences (p < 0.01 indicated by the dotted line) are depicted. e, f Significant genotype × sex interactions in Tyrobp and Ccl6 (p < 0.05) and significant main effects of genotype (p < 0.001) and sex (p < 0.05 or p < 0.01) were identified in mean data from Nanostring analysis and RT-PCR for Tyrobp, Ctsd, Ccl6, and Trem2. Post hoc analysis revealed significant genotype-related increases (*p < 0.05; **p < 0.01) and significant increases in Tyrobp, Ctsd, and Ccl6 in microglia from female, compared with male, APP/PS1 mice (§p < 0.05; §§p < 0.01; §§§p < 0.001) and in several other indicators of microglial activation as indicated in Supplementary Fig. 1. Data, expressed as means ± SEM (n = 5 (PCR data) or 6 (Nanostring data)), were analysed by 2-way ANOVA and Tukey’s post hoc multiple comparison test. The changes in e and f are relative to values in WT males. Additional related data are presented in Supplementary Figs. 1 and 2.

