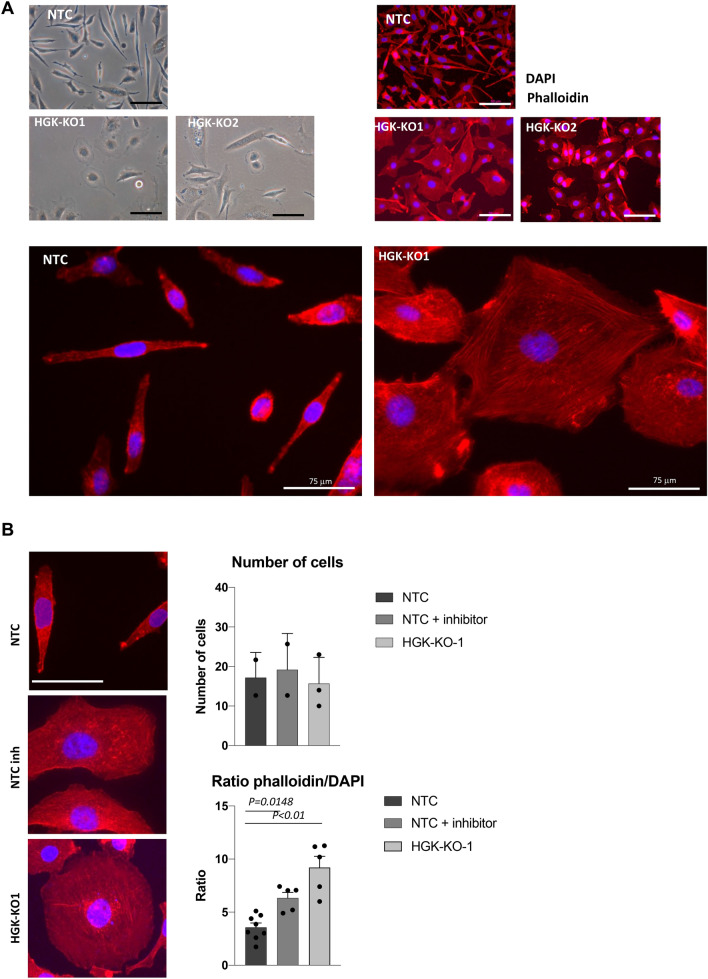
Figure 4.
HGK depletion alters cell actin cytoskeleton organization. (A) Top left panel, Phase-contrast microscopy images of NTC and HGK depleted PC3 cells maintained in the presence of 10% FBS for 24 h. Top Right panel, Immuno-fluorescence microscopy images of phalloidin staining (red) in NTC and HGK depleted PC3 cells. Cell nuclei were stained with DAPI (blue). Scale bars: 75 μm. An amplification of images is depicted. (B) Adhesion analysis at 24 h in indicated cells. Left panels, representative images of adhered PC3 cells. Right top panels, histograms showing the mean value ± S.E.M. of the percentage of adhered cells referred to non-silenced cells at 24 h (n = 3). Right bottom panel, histograms showing the mean value ± S.E.M. of the ratio cytosol/nucleus referred to untreated cells at 24 h.

