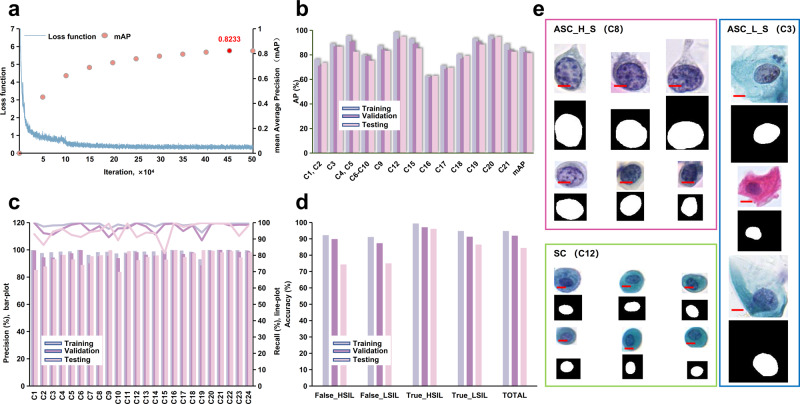
Fig. 3. Training of the deep learning models and their performance.
a The loss function and mean Average Precision (mAP) of YOLOv3 model during the training. b The AP of 13 TBS classifications in YOLOv3 model. The corresponding classification indexes are shown in Fig. 2a and Table 1. c The precision and recall of 24 classifications in the Xception model. (Bar-plot: precision; Line-plot: recall). The corresponding names of each classification as show in Fig. 2a and Table 1. d The accuracy of False_HSIL, True_HSIL, False_LSIL, and True_LSIL in Patch model. e The representative images of ASC_L_S (blue box), ASC_H_S (red box), and SC (green box) in the nucleus segmentation model (true color image: original images, binary image: corresponding masks; Scale Bars: 10 μm).

