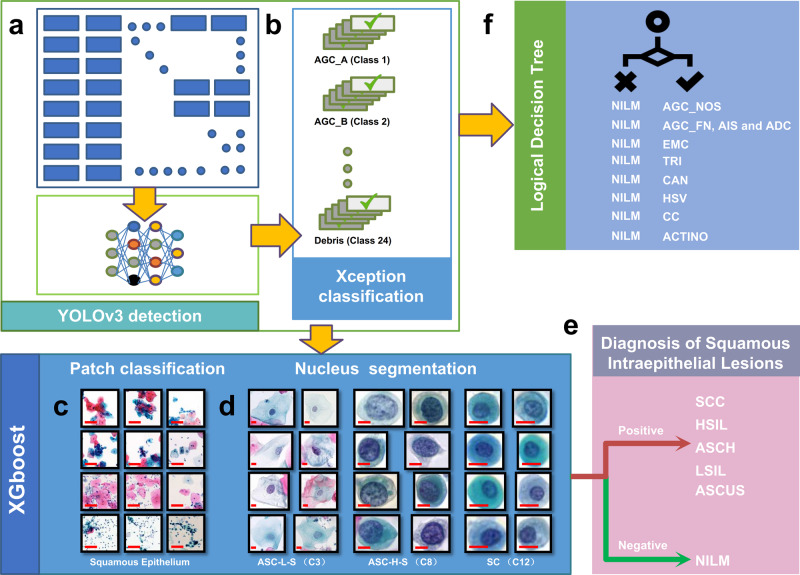
Fig. 4. Diagnostic decision pipeline for TBS classification and diagnosis.
a All digital retrospective smears were detected by the Yolov3 model, and the classification and probability of the detection targets were extracted. b The Xception model predicted the targets detected by the YOLOv3 model, and then the information of classification and probability were extracted. c The Patch model was used to extract area classification and the probability of squamous epithelium targets. (Representative images in Patch model. Scale Bars: 50 μm). d Nuclear parameter extraction of ASC_L_S, ASC_H_S, and SC (Representative images in nucleus segmentation model. The length of Scale Bars in the images of ASC_L_S are 20 μm, while 10 μm in the images of ASC_H_S and SC). e Prediction for TBS classification of squamous intraepithelial lesions. f Logical Decision Tree was used to predict AGC, EMC, and Infectious lesions.

