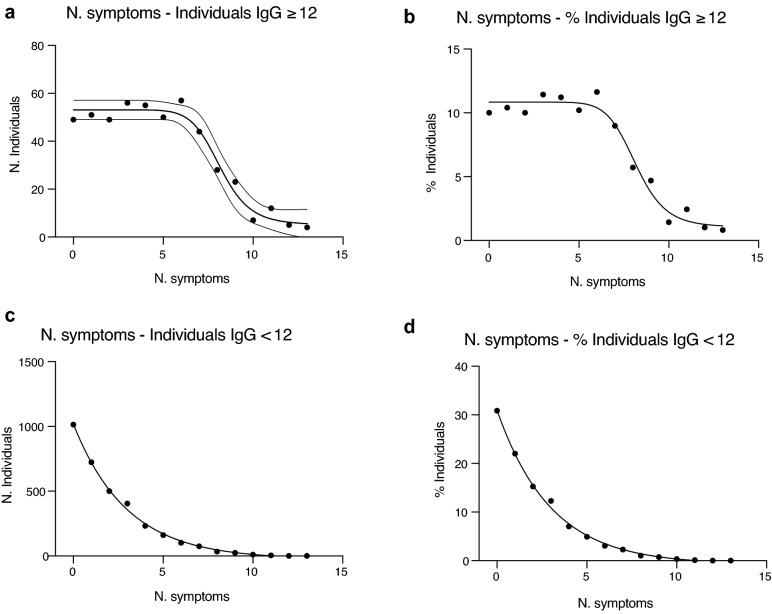
Figure 3.
Distribution of the IgG ≥ 12 and IgG < 12 populations versus the number of symptoms. (a,b) Distribution of the IgG positive individuals (IgG ≥ 12 AU/mL) as number of individuals (a) or percentage of the population (b) versus the number of self-reported symptoms. The curve that best interpolated the data was a sigmoidal, four parameter logistic curve whereby X is the number of symptoms (R2 = 0.97). (c, d) Distribution of the IgG negative individuals (IgG < 12 AU/mL) as number of individuals (c) or percentage of the population (d) versus the number of self-reported symptoms. The curve that best interpolated the data was exponential (R2 = 0.9975).

