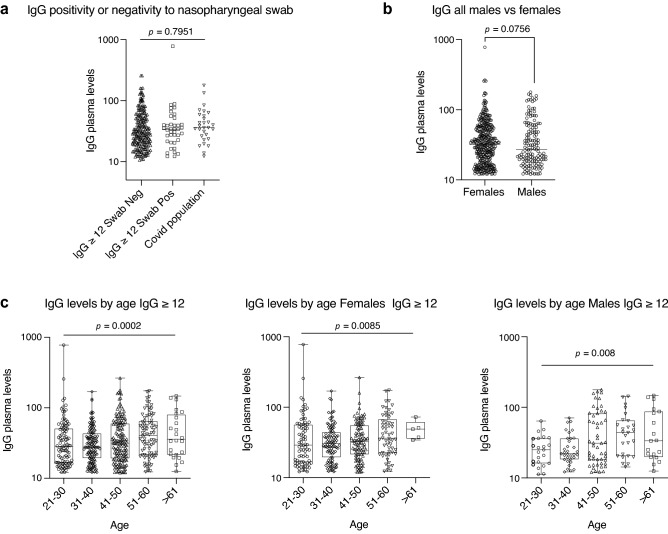
Figure 4.
Distribution of IgG plasma levels in the different populations. (a) Distribution of IgG plasma levels in the cohort of IgG positive individuals (IgG ≥ 12 AU/mL) negative or positive for the nasopharyngeal swab or ascertained COVID-19 disease. (b) Distribution of IgG plasma levels in IgG positive individuals (IgG ≥ 12 AU/mL) divided by sex. (c) Distribution of IgG plasma levels in IgG positive individuals (IgG ≥ 12 AU/mL) divided by age ranges and sex. In (a) and (b) p-values were determined using Cochran Mantel-Haenzel test for trend. In (c) Cuzick’s test for trend was used: p = 0.0002 (total); p = 0.0085 (female); p = 0.008 (male); p = 0.4192 (interaction).

