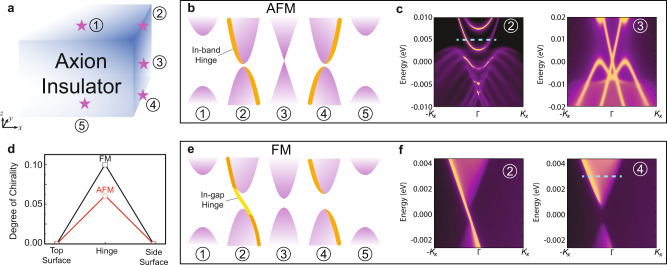
Fig. 3. Spectra of surface and hinge states.
a Schematic of an axion insulator, with its top surface, top hinge, side surface, bottom hinge, and bottom surface marked as ①-⑤, respectively. b,e Schematic of the topological band spectra at spots ①-⑤ for b AFM and e FM MnBi2Te4. The orange and yellow lines denote in-band hinge and in-gap hinge states, respectively. c, f The hinge and the side surface LDOS of c AFM MnBi2Te4 (② and ③) and f FM MnBi2Te4 (② and ④). d The degree of chirality of the in-band hinge states with the Fermi level marked by the blue dashed lines in c and f.

