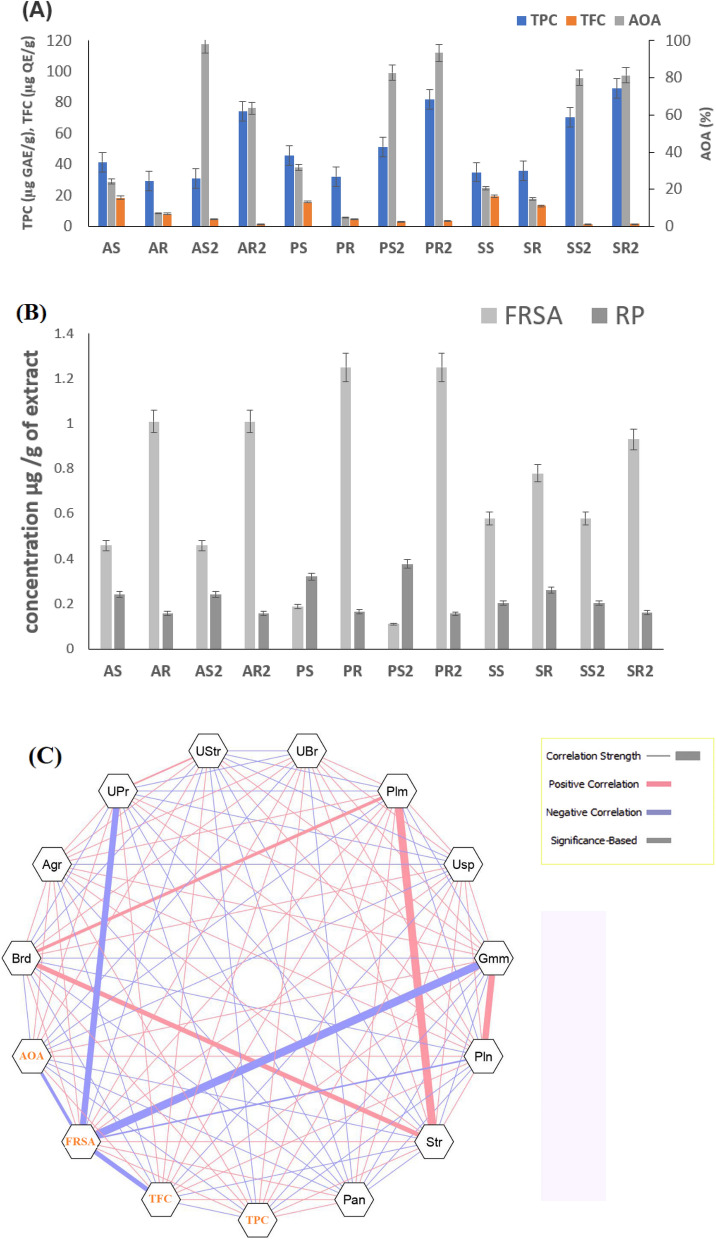
Figure 5.
(A) Antioxidant assay TPC (µg GAE/g), TFC (µg QE/g) and AOA (%) in three variety of black scented rice. Graphs show mean ± SE. [AR-Young Amubi root, AR2-Mature Amubi root; AS-Young Amubi shoot, AS2-Mature Amubi shoot; PR-Young Poreiton root, PR2-Mature Poreiton root, PS-Young Poreiton shoot, PS2-Mature Poreiton shoot; SR-Young Sempak root, SR2-Mature Sempak root , SS-Young Sempak shoot, SS2-Mature Sempak shoot]. (B) Antioxidant activity (Free radical scavenging activity, FRSA) and (Reducing power, RP) of black rice. (C) Network analysis revealing the co-occurrence patterns between bacterial taxa and antioxidants (TPC,TFC,FRSA,AOA). Each of the nodes represents either bacterial genera or antioxidant activity. The thickness of solid line (edge) between nodes denotes the strength of correlation (P < 0.05). Red lines indicate positive correlation while blue lines indicate negative correlation among the abundances of linked taxa. Network was visualized by Cystoscape V3.3.0.

