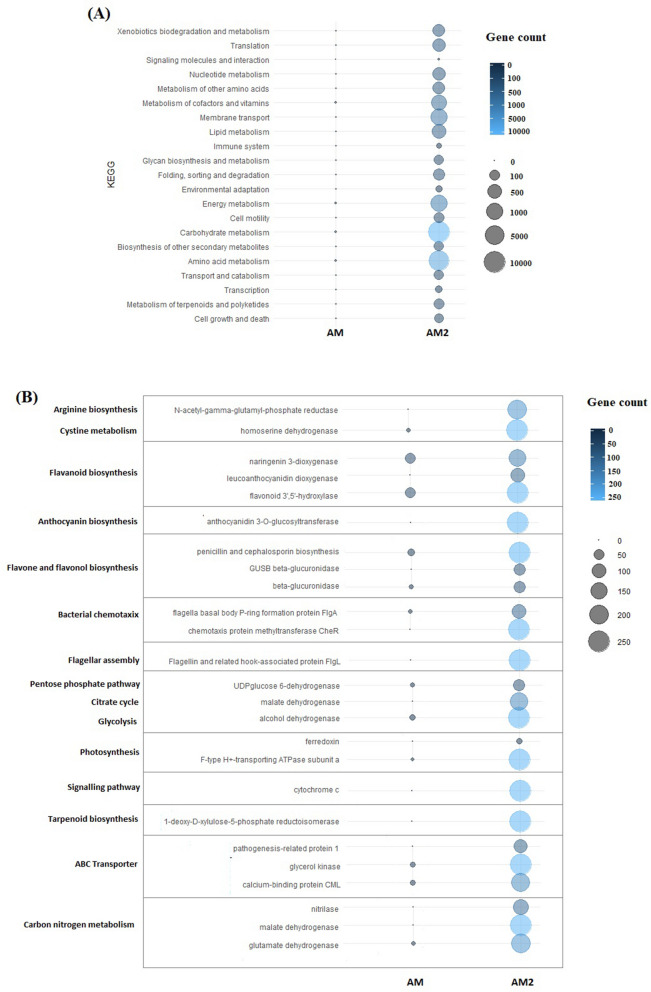
Figure 6.
Bubble plots showing (A) KEGG functional categories of endophyte-based gene count in young and mature scented black rice plant. (B) Functional genes classified under hierarchical KEGG orthology present in the endomicrobiome at early (AM) versus late plant developmental time points (AM2). The size of the bubble signifies the gene count of each KEGG category function in young and mature stages. Colour chart indicator values are displayed.

