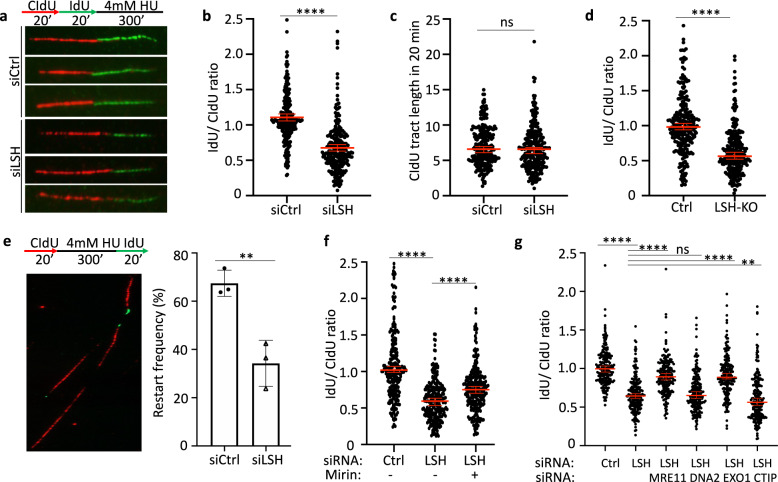
Fig. 2. Reduced nascent DNA protection at stalled replication forks in LSH-deficient cells.
a Schematic diagram of the fork protection assay (upper panel) and representative images of protected or resected nascent DNA from U2OS cells (lower panel). Cells were sequentially labeled in the indicated times with 5-chloro-2′-deoxyuridine (CldU, red) and 5-iodo-2′-deoxyuridine (IdU, green) followed by 4 mM HU exposure. The ratio of IdU/CldU serves as a measure for nucleolytic degradation of nascent DNA. b Nascent DNA degradation analysis in U2OS cells transfected with small interfering RNA (siRNA) to deplete LSH (siLSH) or using control siRNA (siCtrl). Representative of n = 3 independent experiments. Data are represented as median ± 95% CI (n = 250 DNA fibers). ****p < 0.0001 by two-tailed Mann–Whitney test. c CldU tract length analysis (20 min CldU incorporation) in U2OS cells transfected with LSH siRNA (siLSH) or control siRNA (siCtrl). Representative of n = 3 independent experiments. Data are represented as median ± 95% CI (n = 250 DNA fibers). ns = not significant by two-tailed Mann–Whitney test. d Nascent DNA degradation analysis in lipopolysaccharide (LPS)-stimulated LSH-depleted lymphocytes (KO) or control lymphocytes (Ctrl). Representative of n = 3 biologically independent experiments. Data are represented as median ± 95% CI (n = 250 DNA fibers). ****p < 0.0001 by two-tailed Mann–Whitney test. e Schematic diagram of fork restart assay (left upper panel) and a representative image of stalled (red only) or restarted (red-green) nascent DNA (left lower panel). Fork restart analysis from U2OS cells transfected with the indicated siRNA. Data are represented as mean ± SD (n = 3 independent experiments). **p < 0.01 by Student’s two-tailed t test. f Nascent DNA degradation analysis in U2OS cells transfected with the indicated siRNA in the presence or absence of 50 µM Mirin. Representative of n = 3 independent experiments. Data are represented as median ± 95% CI (n = 250 DNA fibers). ****p < 0.0001 by two-tailed Mann–Whitney test. g Nascent DNA degradation analysis in U2OS cells transfected with the indicated siRNA to deplete LSH (siLSH) alone or to deplete LSH together with the nuclease MRE11, DNA2, EXO1, or CTIP. Representative of n = 3 independent experiments. Data are represented as median ± 95% CI (n = 200 DNA fibers). ****p < 0.0001 by two-tailed Mann–Whitney test.

