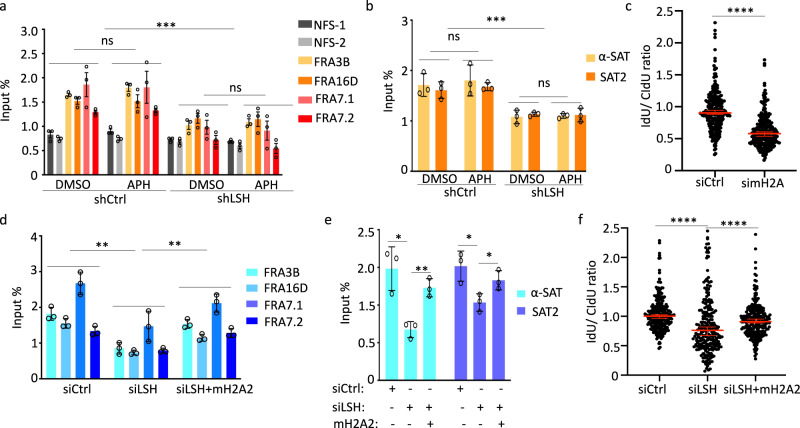
Fig. 3. MacroH2A deficiency phenocopies LSH deficiency.
a ChIP-qPCR analysis for detection of macroH2A1 enrichment at common fragile sites (FRA3B, FRA16D, FRA7.1, and FRA7.2) and control sites (NFS-1, NFS-2) in mock-treated (DMSO) or aphidicolin-treated (APH) U2OS cells transfected with LSH shRNA (shLSH) or control shRNA (shCtrl). Data are represented as mean ± SD (n = 3 independent experiments). ns = not significant, ***p < 0.001 by Student’s two-tailed t test. b ChIP-qPCR analysis for detection of macroH2A1 enrichment at satellite sequences (α-SAT and SAT-2) in mock-treated (DMSO) or aphidicolin-treated (APH) U2OS cells transfected with shLSH or shCtrl. Data are represented as mean ± SD (n = 3 independent experiments). ns = not significant, ***p < 0.001 by Student’s two-tailed t test. c Nascent DNA degradation analysis in U2OS cells transfected with the indicated siRNA. The IdU/CldU ratio calculations are done as outlined for Fig. 2a. Representative of n = 3 independent experiments. Data are represented as median ± 95% CI (n = 250 DNA fibers). ****p < 0.0001 by two-tailed Mann–Whitney test. d ChIP-qPCR analysis for mH2A2 enrichment at CFSs in untreated U2OS cells transfected with the indicated siRNA (siCtrl or siLSH) and with macroH2A2 expressing construct (mH2A2 + siLSH). Data are represented as mean ± SD (n = 3 independent experiments). **p < 0.01 by Student’s two-tailed t test. e ChIP-qPCR analysis for mH2A2 enrichment at satellite sequences (α-SAT and SAT-2) in untreated U2OS cells transfected with the indicated siRNA (siCtrl or siLSH) and with a macroH2A2-expressing construct (siLSH + mH2A2). Data are represented as mean ± SD (n = 3 independent experiments). *p < 0.05, **p < 0.01 by Student’s two-tailed t test. f Nascent DNA degradation analysis in U2OS cells transfected with the indicated siRNA (siCtrl or siLSH) and with a macroH2A2-expressing construct (siLSH + mH2A2). The IdU/CldU ratio calculations are done as outlined for Fig. 2a. Representative of n = 3 independent experiments. Data are represented as median ± 95% CI (n = 250 DNA fibers). ****p < 0.0001 by two-tailed Mann–Whitney test.

