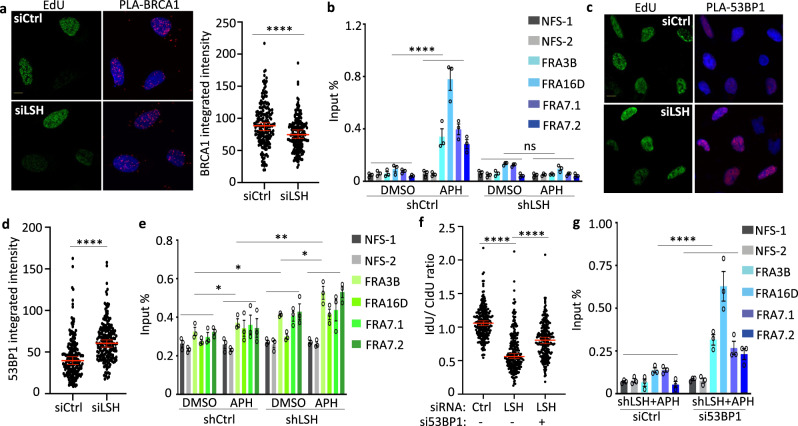
Fig. 6. Reduced BRCA1 and increased 53BP1 occupancy at stalled replication forks.
a Representative images (left panel) and quantification of PLA signals (BRCA1: EdU) from U2OS cells transfected with the indicated siRNA after exposure to 4 mM HU for 5 h. The scale bar represents 10 µm. Quantification of PLA signals (BRCA1: EdU) is based on EdU-positive cells. Representative of n = 3 independent experiments. Data are represented as median ± 95% CI (n = 200 cells). ****p < 0.0001 by two-tailed Mann–Whitney test. b ChIP-qPCR analysis for detection of BRCA1 enrichment at CFSs (FRA3B, FRA16D, FRA7.1, and FRA7.2) and control sites (NFS-1, NFS-2) in mock-treated (DMSO) or aphidicolin-treated (APH) U2OS cells transfected with shLSH or shCtrl. Data are represented as mean ± SD (n = 3 independent experiments). ns = not significant, ****p < 0.0001 by Student’s two-tailed t test. c Representative images of PLA signals (53BP1: EdU) from U2OS cells transfected with the indicated siRNA after exposure to 4 mM HU for 5 h. The scale bar represents 10 µm. d Quantification of PLA signals (53BP1: EdU) from U2OS cells as treated in Fig. 6C. Quantification of PLA signals (53BP1: EdU) is based on EdU-positive cells. Representative of n = 3 independent experiments. Data are represented as median ± 95% CI (n = 200 cells). ****p < 0.0001 by two-tailed Mann–Whitney test. e ChIP-qPCR analysis for detection of 53BP1 enrichment at CFSs (FRA3B, FRA16D, FRA7.1, and FRA7.2) and control sites (NFS-1, NFS-2) in mock-treated (DMSO) or aphidicolin-treated (APH) U2OS cells transfected with shLSH or shCtrl. Data are represented as mean ± SD (n = 3 independent experiments). *p < 0.05, **p < 0.01 by Student’s two-tailed t test. f Nascent DNA degradation analysis after exposure to HU in U2OS cells transfected with siCtrl or siLSH or a combination of siLSH and si53BP1 leading to an intermediate 53BP1 depletion (0.3 in Supplementary Fig. 13B). The IdU/CldU ratio calculations are done as outlined in Fig. 2a. Representative of n = 3 independent experiments. Data are represented as median ± 95% CI (n = 250 DNA fibers). ****p value < 0.0001 by two-tailed Mann–Whitney test. g ChIP-qPCR analysis for detection of BRCA1 enrichment at indicated CFSs in aphidicolin treated (APH) U2OS cells transfected with shLSH and either siCtrl or si53BP1. Data are represented as mean ± SD (n = 3 independent experiments). ****p < 0.01 by Student’s two-tailed t test.

