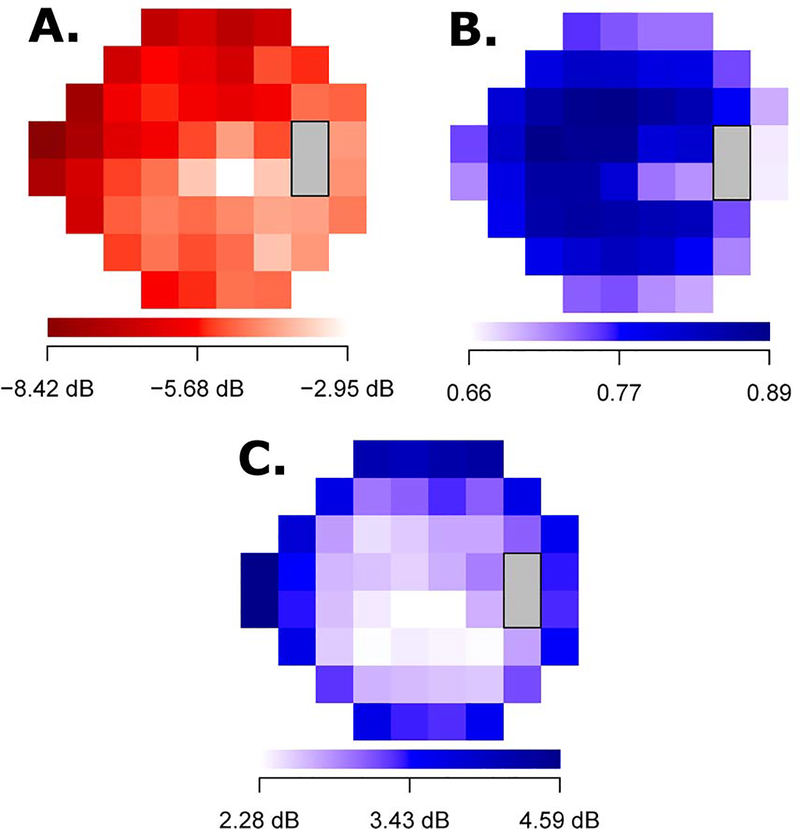
Figure 3.
(A)The average TD values of the first VF at 52 test location, (B) the intraclass correlations of the TD values at the 52 locations between the first and retest VFs (p < 0.001 at all locations), (C) the pointwise test-retest variability measured by absolute total deviation differences at 52 test locations (p < 0.001 at all locations, differing from zero). TD = total deviation; VF = visual field. P values were corrected for multiple comparisons.

