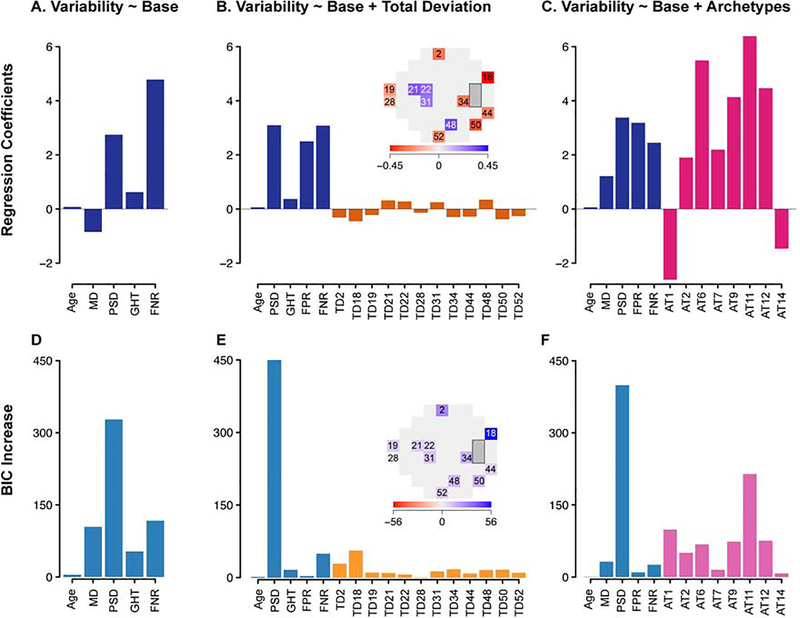
Figure 5.
Best predictive models for test-retest variability using stepwise linear regression. Top panel (A-C): regression coefficients for (A) “base model” selected from global and reliability indices only, (B) “base + total deviation (TD) model” selected from base parameters as well as TD values at 52 locations, and (C) “base + archetype (AT) model” selected from base parameters as well as archetypes. Bottom panel (D-F): increase in Bayesian information criterion (BIC) when each parameter is removed from the respective models. Blue = base parameters; orange = TD values; red = archetypes. MD = mean deviation; PSD = pattern standard deviation; GHT = glaucoma hemifield test; FNR = false negative rate; FPR = false positive rate.

