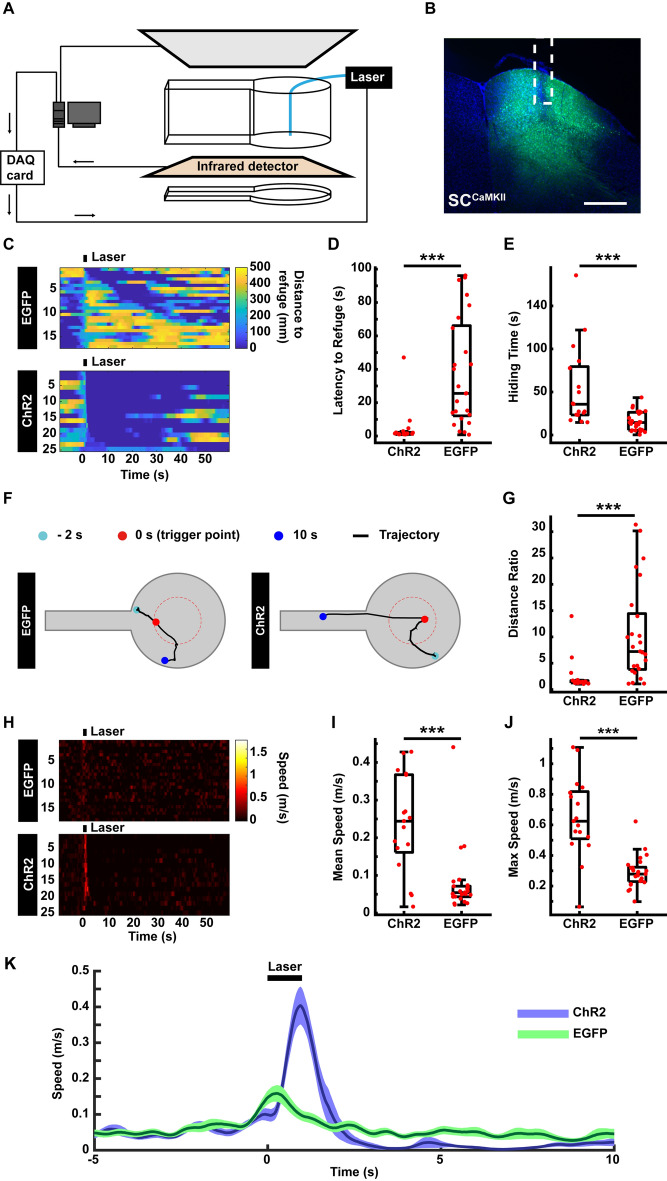
Fig. 5.
Optogenetic test in the AIBM system. A Schematic of the optogenetic-AIBM system. The optogenetics laser was triggered by the data acquisition (DAQ) card. B Expression of the AAV-CaMKII-ChR2-mcherry virus in the SC and the optic fiber position (white dotted line). Scale bar, 500 µm. C Distance of mice to refuge before, during, and after optogenetic stimuli. Upper, control group expressing AAV-CaMKII-EGFP in the SC. Lower, ChR2 group expressing AAV-CaMKII-ChR2-EGFP in the SC. Laser stimuli lasted 1 s. D Latency to the refuge following optogenetic stimuli. E Time spent hiding in the refuge after optogenetic stimuli. F Representative trajectories of the negative control group (left) and the optogenetic group (right). G Distance ratio of the returning trajectory. H Speed of mice to the refuge before, during, and after optogenetic stimuli. Upper, the negative control group. Lower, the ChR2 group. I Mean speed when returning to the refuge following optogenetic stimuli. J Maximum speed when returning to the refuge following optogenetic stimuli. K Average speed curve before, during, and after optogenetic stimuli. n = 25 trials from 5 mice in the control group. n = 17 trials from 6 mice in the ChR2 group. ***P <0.001, experimental vs control groups, rank sum tests.

