Fig. 6.
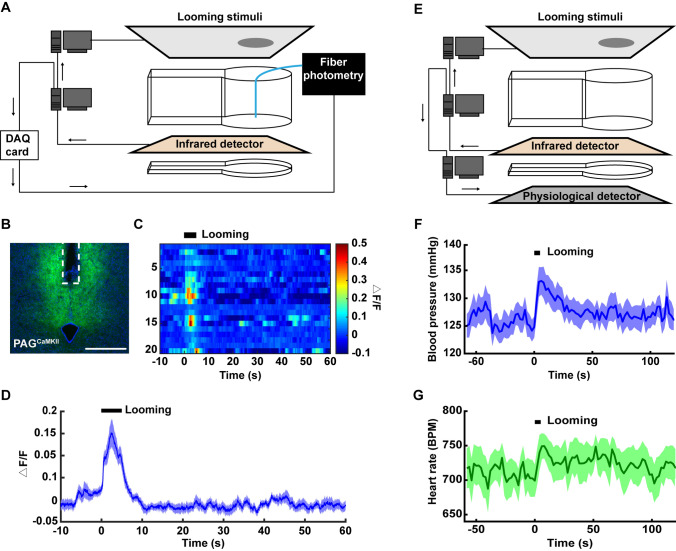
The AIBM system integrated with the looming stimuli test combined with fiber photometry recording or blood pressure measurement. A Schematic of the AIBM system with the looming test paradigm combined with a fiber-photometry recording system. Looming stimuli were triggered through the serial port and time synchronization between the AIBM system and fiber photometry were through the data acquisition (DAQ) card. B Expression of AAV-CaMKII-GCaMP6 virus in the dPAG and optic fiber position (white dotted line). Scale bar, 500 µm. C Ca2+ responses during each trial before, during, and after looming stimuli. The duration of the looming stimulus was 5.5 s. Each line represents one trial of the looming test. n = 20 trials from 4 mice. D Ca2+ response curve. Line, mean Ca2+ response; shadow, SEM. E Schematic of the AIBM system with the looming test paradigm combined with a blood pressure measurement system (DSI, MN). Looming stimuli were triggered through a serial port, as was the time synchronization between the AIBM system and the blood pressure measurement system. F Blood pressure curve. Line, mean blood pressure; shadow, SEM. G Heart rate curve. Line, mean heart rate; shadow, SEM. n = 14 trials from 4 mice. Each dot represents the result of 1 looming test trial. *P <0.05, **P <0.01, ***P <0.001, experimental vs control groups, rank sum tests.

