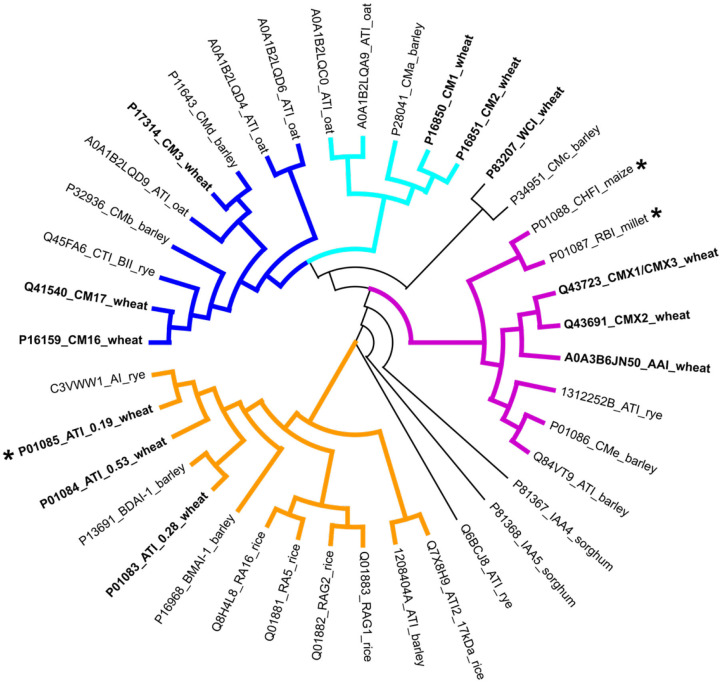
Figure 3.
Phylogenetic analysis of ATIs in cereal species with wheat ATIs shown in bold. The sequence conservation of the ATIs is very low, but comparison of the three ATIs for which 3D structures have been determined (indicated by stars) shows that structural conservation is high. The coloring of the subgroups follows that used in Figure 1: blue and cyan, heterotetrameric; purple, trypsin/bifunctional inhibitors; orange, monomeric and homodimeric). Software used: MEGA X (12) (Muscle for alignment preparation and Maximum likelihood for phylogeny analysis), and Dendroscope (13).

