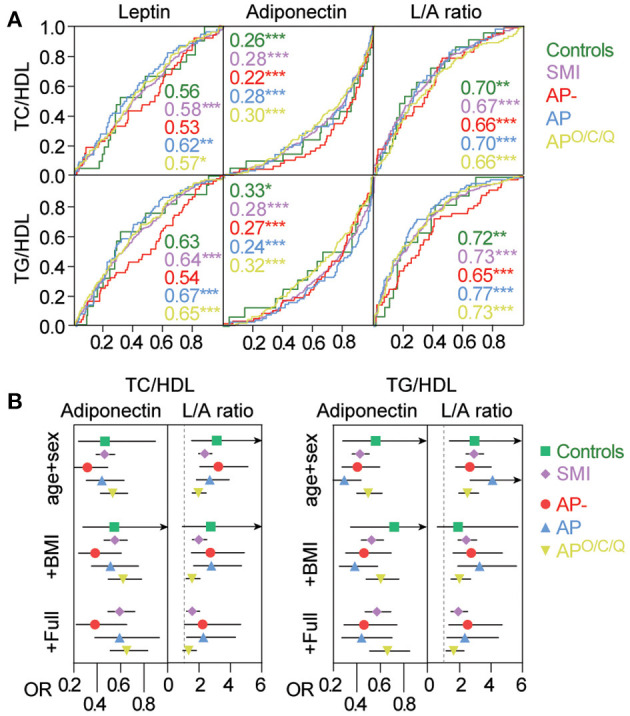
Figure 2.

Association between Adiponectin and the L/A ratio and atherogenic risk. (A) Association between Adiponectin or the L/A ratio, and having a TC/HDL or TG/HDL above threshold levels as assessed by the area under the receiver-operating characteristics curve (ROC). Numbers indicate the AUC in the different groups. *p < 0.05 **p < 0.01 ***p < 0.001. (B) Association between adiponectin and L/A levels and cardiovascular risk (TC/HDL, TG/HDL) using logistic regression with adjustment levels for a. Age and sex b. a+BMI c. b+C-reactive protein (CRP), insulin resistance (HOMA-IR), smoking, and anti-psychotic treatment dose (DDD), duration of illness, mood stabilizers (DDD), duration of AP treatment. Odds ratios (OR) are expressed as log-transformed per SD change in marker. Odds ratios with 95% Confidence interval are given in Supplementary Tables 2, 3.
