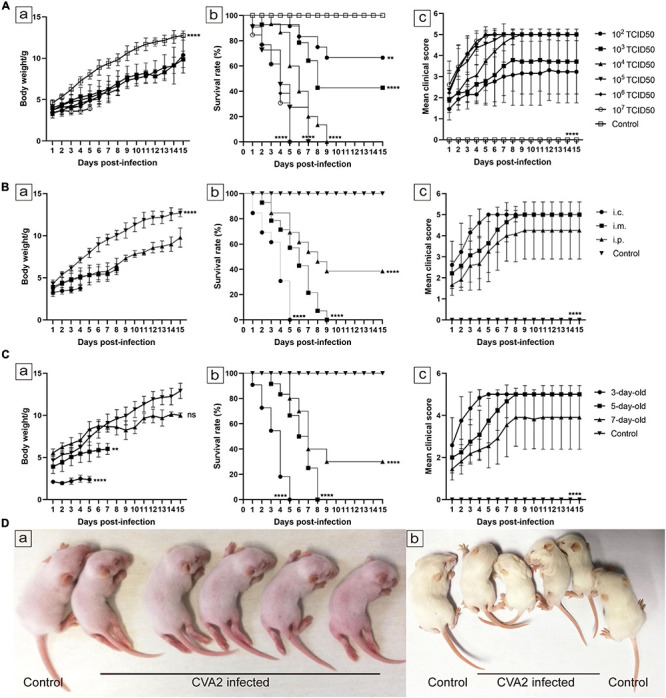
FIGURE 2.

Establishment of the CVA2 infection mouse model. (A–C) Body weights, survival rates, and mean clinical scores of mice. Five-day-old BALB/c mice (n = 10∼15 per group) were i.m. inoculated with different doses of CVA2 (102∼107 TCID50/mouse, respectively). Control animals were administered culture medium instead of virus. The body weights (A-a,B-a,C-a), survival rates (A-b,B-b,C-b), and clinical scores (A-c,B-c,C-c) in each group of neonatal mice were measured. (D) Two representative pictures of clinical signs (weight loss, reduced mobility, ataxia, and single or double hind limb paralysis) induced by CVA2 in mice. a. 5 dpi and b. 7 dpi. **P < 0.01; ****P < 0.0001; ns, non-significant result.
