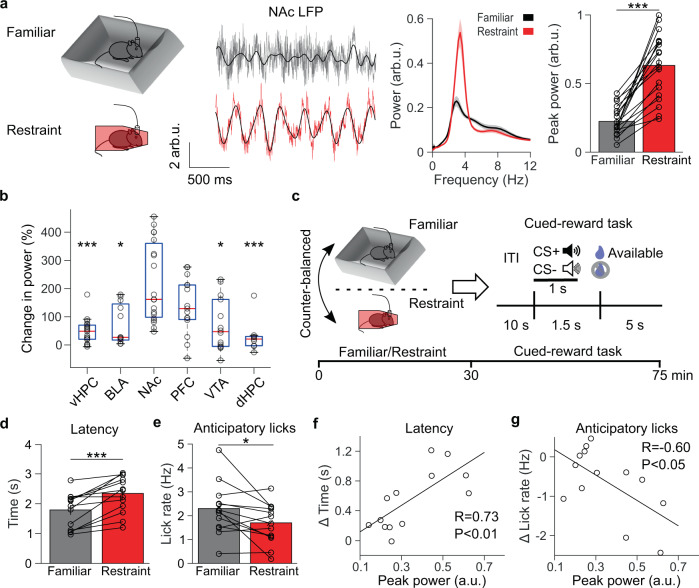
Fig. 1. Restraint stress re-organizes the NAc LFP and impairs subsequent reward-seeking.
a Far left: experimental design. Left: representative traces of the nucleus accumbens (NAc) local field potential (LFP) of a mouse freely exploring a familiar environment (gray) or during restraint (red), overlaid with the 2–7 Hz filtered signal (black). Voltage is normalized to the root mean square of a baseline recording and reported in arbitrary units (arb.u.). Right: average NAc LFP power spectra of mice exploring a familiar environment (black) or during restraint stress (red). Far right: restraint increases peak NAc power in the 4 (2–7) Hz range (***P = 0.00013 two-tailed signed-rank test, n = 19 mice). Data are mean ± s.e.m. b The percent change in peak 4 Hz power from familiar to restraint was larger in the NAc than the ventral hippocampus (vHPC), basolateral amygdala (BLA), VTA, and dorsal hippocampus (dHPC) (P < 0.0001 Kruskal–Wallis test; post hoc Tukey–Kramer comparisons ***PvHPC < 0.0001, nvHPC = 19 mice, *PBLA = 0.014, nBLA = 12 mice, PPFC = 0.20, nPFC = 15 mice, *PVTA = 0.015 nVTA = 14 mice, ***PdHPC < 0.0001, ndHPC = 9 mice, nNAc = 10 mice). Data are plotted with median, upper and lower quartiles, and 1.5x interquartile range. c Experimental design. d Restraint stress increases the time to first lick during the reward availability period in the cued-reward task (***P = 0.00049 two-tailed signed-rank test, n = 13 mice). Data are mean ± s.e.m. e Restraint stress decreases average anticipatory lick rate between CS+ onset and reward availability (*P = 0.011 two-tailed paired t test, n = 13 mice). Data are mean ± s.e.m. f Relationship between peak 4 Hz NAc power during restraint and the change in latency to reward retrieval from after familiar environment exploration to after restraint (**P < 0.0049 Pearson correlation, n = 13 mice) g The same as f, but for the change in anticipatory lick rate from after familiar environment exploration to after restraint (*P = 0.029 Pearson correlation, n = 13 mice).

