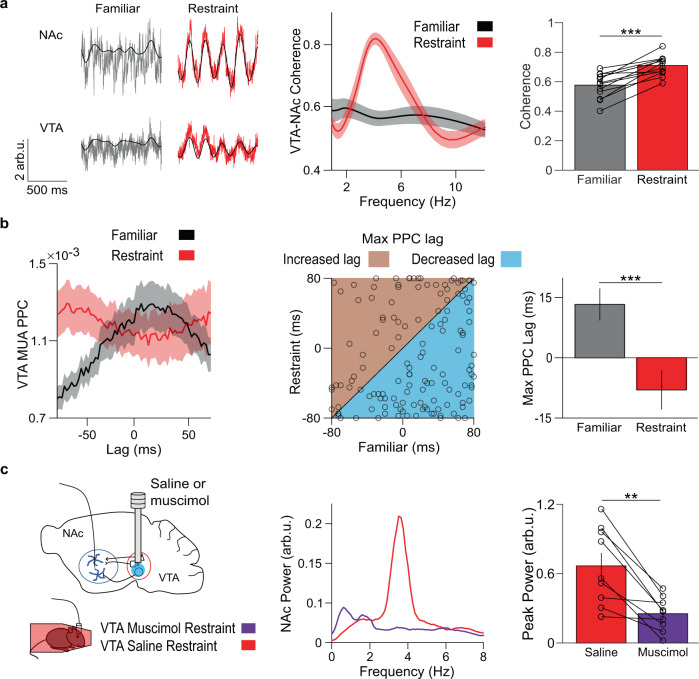
Fig. 3. VTA neural activity leads NAc activity during restraint.
a Left: example traces of NAc and VTA LFPs during familiar environment exploration (gray) or restraint (red), overlaid with the 4 Hz filtered signal (black). Center: coherence of VTA and NAc LFPs. Right: restraint increases average VTA-NAc coherence in the 4 Hz range (***P = 0.00024 two-tailed paired t test, n = 13 mice). Data are mean ± s.e.m. b Left: PPC between VTA MUA and the 4 Hz filtered NAc LFP at different MUA time lags. Restraint increased synchrony of NAc 4 Hz phase with past VTA MUA. Center: relationship between lag of max VTA MUA-NAc PPC during familiar environment exploration and restraint, with the line of equality for reference. Right: summary of data from the center panel. Restraint reorganized VTA MUA from predominantly lagging NAc phase to predominantly leading NAc phase (***P = 0.00033 two-tailed signed-rank test, n = 138 multi-units). Data are mean ± s.e.m. C Left: experimental design. Center: example NAc LFP power spectra following VTA infusion of saline (red) or muscimol (violet). Right: Muscimol reduced maximum 4 Hz NAc power during restraint (**P = 0.0020 two-tailed signed-rank test, n = 9 mice). Data are mean ± s.e.m.

