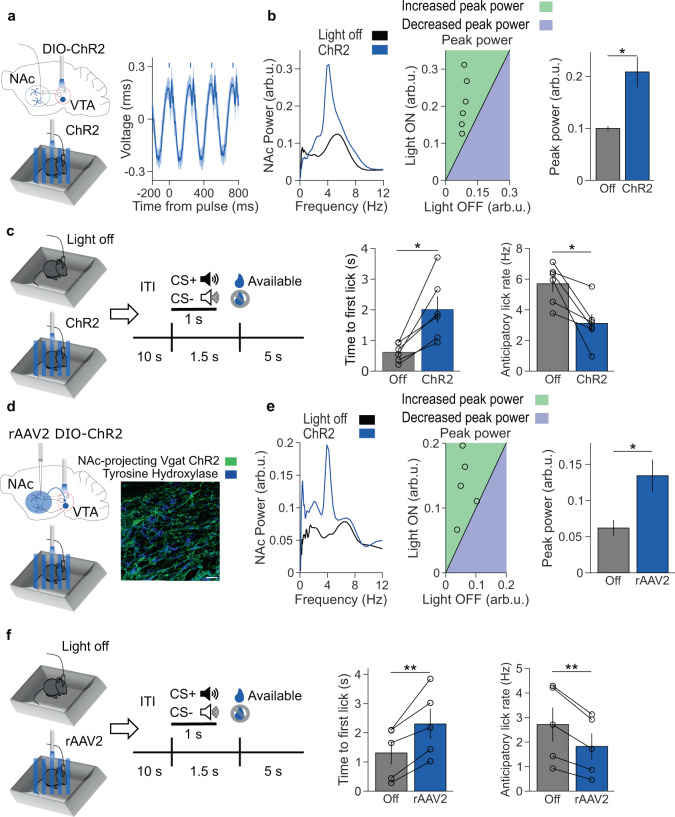
Fig. 6. Activation of NAc-projecting VTA GABA neurons produces a low-frequency oscillation and impairs reward-seeking.
a Left: experimental design. Right: event-related potential of NAc LFP. Bars indicate 10 ms laser pulse onset. b Left: representative NAc spectra with no stimulation (black) and rhythmic low-frequency stimulation (blue). Center: relationship between max 4 Hz NAc power during light off and stimulation, with a line of equality for reference. Right: summary of data from the center panel. ChR2 stimulation increased peak 4 Hz NAc power (*P = 0.031 two-tailed signed-rank test, n = 6 mice). Data are mean ± s.e.m. c Left: experimental design. Right: rhythmic ChR2 stimulation impaired subsequent reward retrieval latency and anticipatory lick rate (*P = 0.031 and *P = 0.031, two-tailed signed-rank test, n = 6 mice). Data are mean ± s.e.m. d Left: experimental design. Right: immunofluorescent image of retrograde ChR2 expression (green) in a Vgat-ires-Cre mouse VTA, with tyrosine hydroxylase counterstain (blue). The scale bar is 30 µm. Representative of five experiments. e Left: representative NAc spectra of no stimulation and rhythmic low-frequency stimulation. Center: relationship between max 4 Hz NAc power during light off and stimulation, with the line of equality for reference. Right: Summary of data from the center panel. Stimulating NAc-projecting VTA GABA neurons increased peak 4 Hz NAc power (*P = 0.040 two-tailed paired t test, n = 5 mice). Data are mean ± s.e.m. f Left: experimental design. Right: rhythmic VTA illumination impaired subsequent reward retrieval latency and anticipatory lick rate (**P = 0.0091 and **P = 0.0057 two-tailed paired t test, n = 5 mice). Data are mean ± s.e.m.

