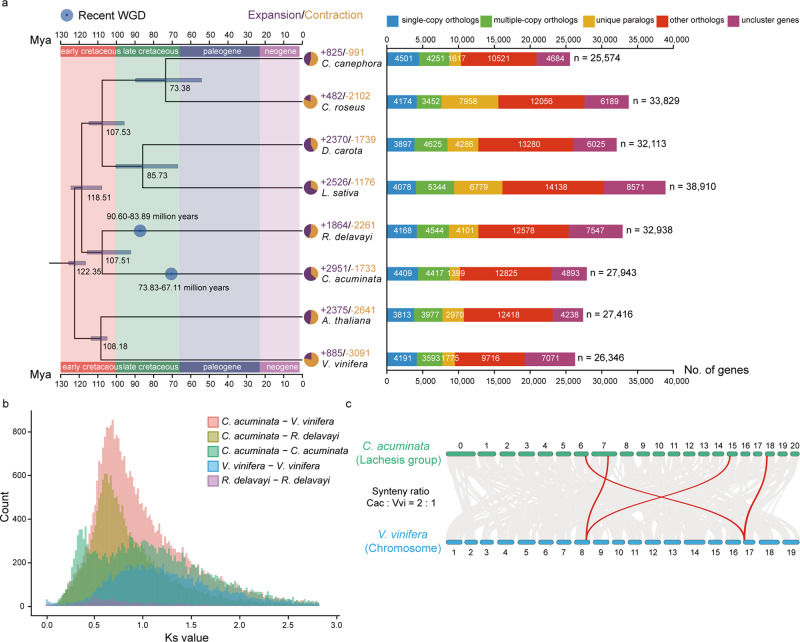
Fig. 1. Phylogenetic analysis of the C. acuminata genome.
a Phylogenetic tree for C. acuminata and seven other plants. Genes of C. acuminata and other sequenced genomes are classified into five classes and the direct numbers (n) are shown on the right with bar charts. All branch bootstrap values are 100. Gene family expansions are indicated in purple, and gene family contractions in light-brown; the corresponding proportions among the total changes are shown using the same colors in the pie charts. The estimated divergence time (million years ago, MYA) is indicated at each node; bars are 95% confidence intervals (CI) (each center is defined as mean value). Circles in blue represent recent whole-genome duplication (WGD) events. b Ks values revealed a recent WGD event during the evolution of C. acuminata and a WGD event shared by C. acuminata and V. vinifera. c Collinear relationship between C. acuminata and V. vinifera chromosomes. The collinearity pattern shows that typically an ancestral region in the V. vinifera genome can be traced to two regions in C. acuminata. Gray bands in the background indicate syntenic blocks between the genomes spanning more than 15 genes; some of the 1:2 blocks are highlighted in red. Source data underlying Fig. 1a, b are provided as a Source Data file.

