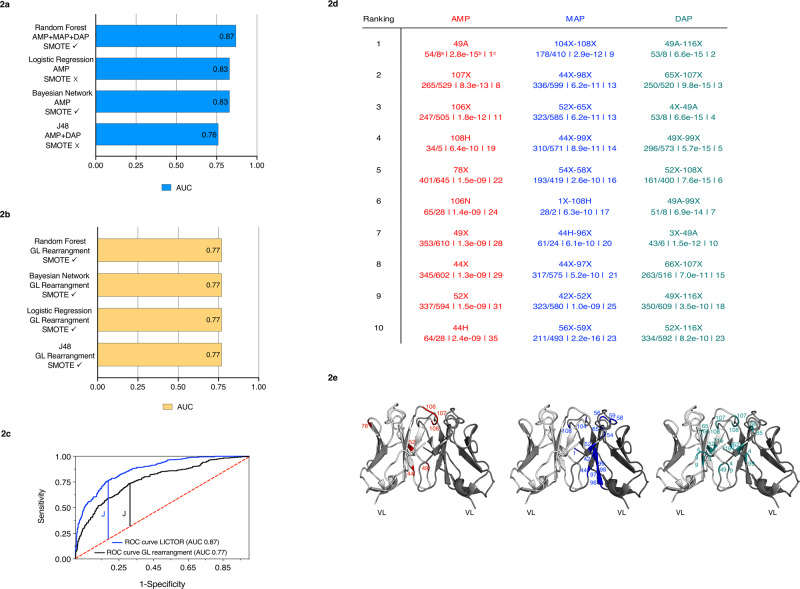
Fig. 2. Machine learning predicts toxic and non-toxic sequences and identifies key features of toxicity.
a AUC of the best configuration for each of the considered machine learners (blue bars). Different combinations of three families of predictor variables were tested, with (✓) or without (✗) the SMOTE balancing technique. b The yellow bars show the best AUC value obtained by each machine learner using only the LC germline VJ rearrangements as predictor variables. c ROC curve for LICTOR (i.e. random forest using AMP + MAP + DAP) compared with a predictor (random forest) using only the LC germline VJ rearrangements as predictor variables. d Top 10 features of each family ranked by information gain. Each feature is enumerated according to our sequential numbering scheme, while the corresponding Kabat-Chothia enumeration for each feature is reported in parenthesis. Kabat-Chothia insertions are reported with lowercase letters. Below each predictor variable are shown the occurrence in tox/nox sequences (a), the p-value (b) and the feature selection general ranking (c) (red = AMP features, blue = MAP features and green = DAP features). e Mapping of the top 10 features of each family on the variable domains of an LC homodimeric structure (PDB ID: 2OLD, represented in white and grey in cartoon). AMP features are shown in red in the left image, MAP features in blue in the middle image and DAP features in green in the right image. The colour code used in the table to represent the three feature families is maintained in their structural representation in (d).

