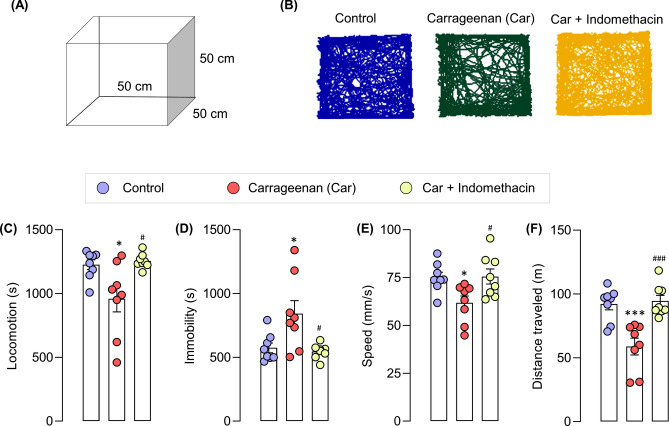
Figure 5.
Locomotor activity driven by exploratory behaviors of control mice, carrageenan mice, carrageenan + indomethacin mice in the open-field test. Data are expressed as means ± SEM from 8 mice in each group. *, *** denote significant difference compared to the control group at p < 0.05, and p < 0.001, respectively. # and ### denote significant difference compared to indomethacin-treated group at p < 0.05, p < 0.001, respectively.

