
Figure 2.
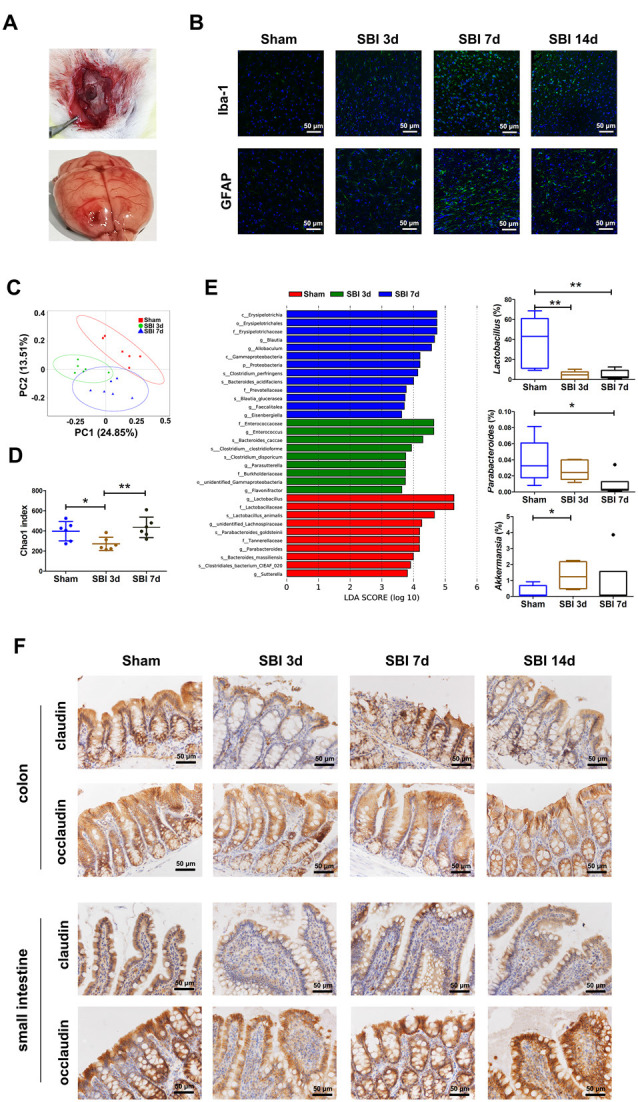
Establishment of surgical brain injury (SBI) models and demonstration of dysbiosis and damage to tight junction proteins in the model. (A) The process of manipulation of the SBI model. (B) Iba and GFAP expression scoring of microglia and astrocytes measured at 3 and 7 days after SBI compared with those of the sham group. (C) Principal coordinate analysis based on unweighted UniFrac distances revealing the difference in bacterial communities clustered between the sham and SBI groups at 3 and 7 days. Each circle represents a single sample, colored by group. The eigenvalues of the principal coordinates PC1 and PC2 were 24.85% and 13.51%, respectively. Differences in the beta diversity between the sham and SBI groups at 3 and 7 days were tested by permutational multivariate analysis of variance (Adonis). (D) Comparison of alpha-diversity indices (Chao1 index taxonomic units) between the sham and SBI groups at 3 and 7 days. **Indicates p < 0.01 by the Wilcoxon rank-sum test. (E) Linear discriminant analysis effect size identified the most differentially abundant taxa among the three groups. Only taxa meeting an LDA significance threshold of >3 are shown. Relative abundances of Lactobacillus, Parabacteroides, and Akkermansia among the three groups. *p < 0.05, **p < 0.01 by the Wilcoxon rank-sum test. (F) Representative images of occludin and claudin immunofluorescence staining in the colon and small intestinal tissues.