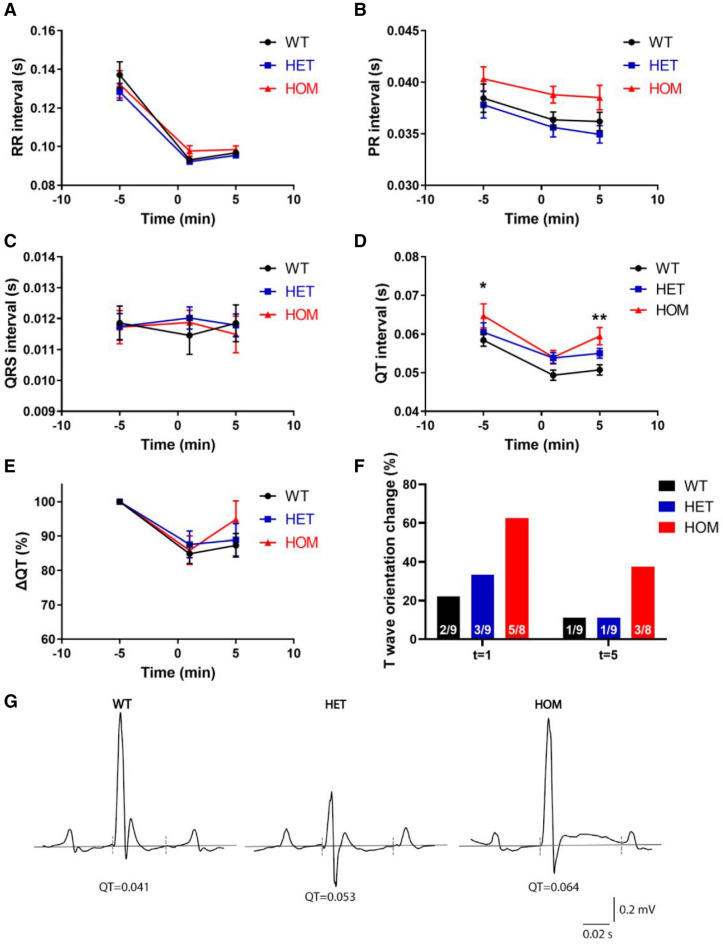
Figure 1.
Electrocardiograms during anaesthesia confirm longer QT interval. (A–D) RR interval (A), PR interval (B), QRS duration (C) and QT interval (D) at baseline and after isoprenaline administration in WT (n = 9), HET (n = 9) and HOM (n = 8) mice. (E) QT (%) change from baseline. (F) Isoprenaline induced changes in T wave orientation in a subset of WT and HET mice and the majority of HOM mice 1 min after administration, which subsided 5 min after administration in the majority of cases. (G) Representative traces five minutes after isoprenaline injection. The dashed lines indicate where QT was measured using the tangent approach. Note that in this HOM mouse, the T wave was not only prolonged, but also became positive, illustrating the T wave orientation changes of F. (A–E) tested with two-way ANOVA with Dunnett’s multiple comparisons testing. *: WT versus HOM, P < 0.05, **: WT versus HOM, P < 0.01. ANOVA, analysis of variance; HET, heterozygous; HOM, homozygous; WT, wild-type.

