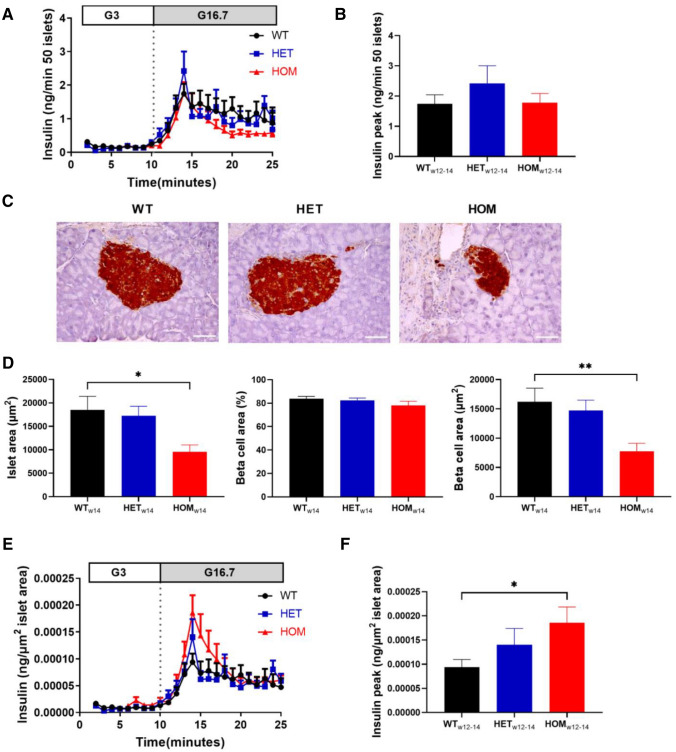
Figure 4.
Ex vivo glucose-stimulated insulin secretion and islet area in 12–14 week-old mice. (A) Isolated islets from 12 to 14 week old WT (n = 8), HET (n = 6) and HOM (n = 6) mice were stimulated with 3 and then 16.7 M glucose, and insulin was measured in the perifusate. (B) Peak insulin was compared. (C) Pancreatic sections of mice at 14 weeks of age were stained for insulin in WT (n = 6), HET (n = 7) and HOM (n = 7) mice, thereby staining beta-cells brown as shown in representative images (scale bar: 50 µm). (D) Islet area, percentage of beta-cell area and absolute beta-cell area were measured in 5 islets per mouse and subsequently averaged per mouse. (E) Insulin secretion curves from (A) normalized to islet area from (D) averaged per group, revealing increased peak insulin (F) in HOM. Tested with one-way ANOVA with Dunnett’s multiple comparisons testing. *: WT versus HOM, P < 0.05, **: WT versus HOM, P < 0.01. ANOVA, analysis of variance;HET, heterozygous; HOM, homozygous; WT, wild-type.

