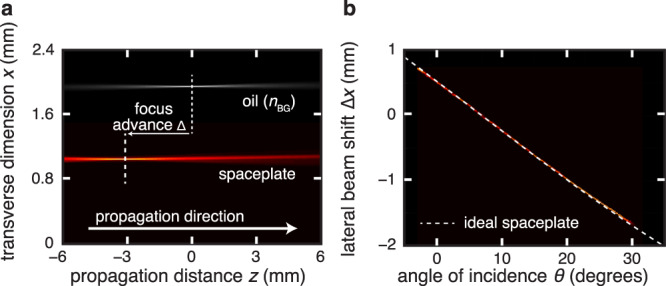
Fig. 3. Experimental demonstration of space compression.

For all plots, the false color along the plot vertical gives the transverse intensity distribution along x at each z distance on the horizontal plot axis, with paler color corresponding to higher intensity. a Focal shift, Δ = d − deff. Top data: oil (gray). A converging beam comes to focus in oil at z = 0. Bottom data: uniaxial spaceplate (red). Propagation of an e-polarized beam through a calcite crystal with its fast axis along z advances the focus position by Δ = −3.4 mm. The corresponding y intensity distributions are shown in Supplementary Note 6.1 in the Supplementary Information, demonstrating a fully two-dimensional advance. b The walk-off of a beam incident at an angle θ. The dashed line gives the lateral beam shift for an ideal spaceplate (i.e., Δx = −(R − 1)d sinθ) with the same thickness d and compression factor R as the spaceplate in a. The uniaxial birefringent crystal acts as a perfect spaceplate for all measured angles of incidence.
