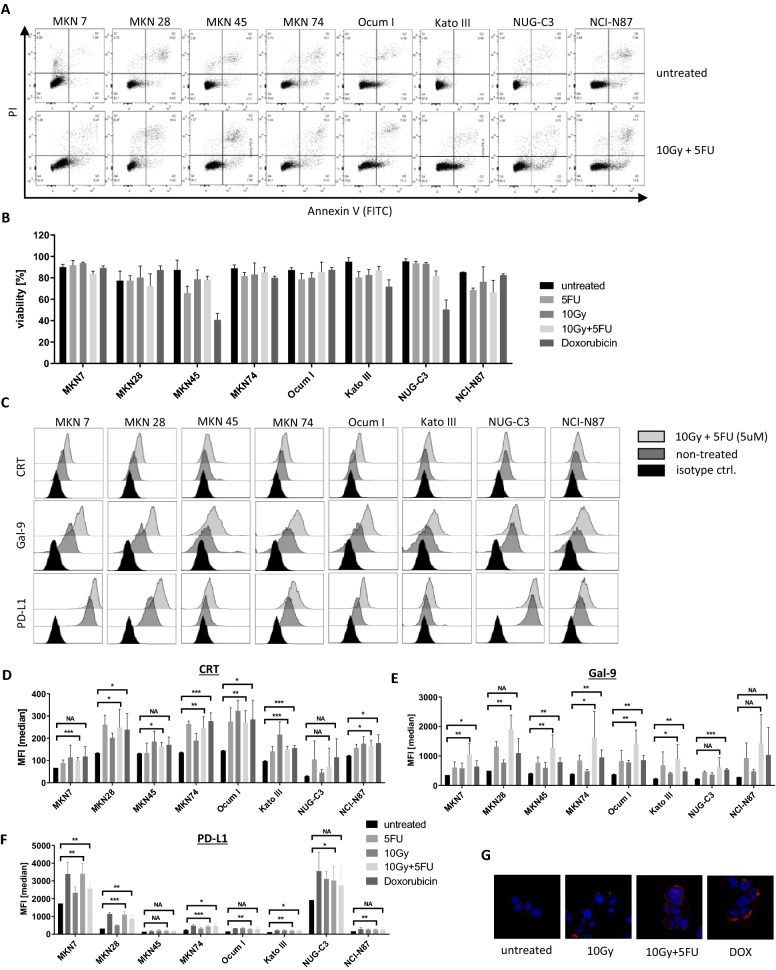
Figure 2.
Chemo-/radiation induced ICD and upregulation of Gal-9 and PD-L1 in GC cell lines. Eight GC cell lines were treated with a single dose of 5FU (5 μM), X-ray irradiation (10 Gy), chemoradiation or DOXO (0.5 μM) and analyzed 48 h after single dose treatment. (A) Flow cytometry data displaying level of apoptosis in each cell line for untreated and chemoradiation treated cells, (B) bar graph of viability of GC cell lines for each condition, (C) representative flow cytometry data for protein expression of CRT, Gal-9 and PD-L1 in each cell line, either untreated or after chemoradiation, (D–F) bar graphs displaying MFI for CRT, Gal-9 and PD-L1, respectively, (G) immunofluorescent imaging of CRT expression in MKN74 cells. Bar graphs display the mean and SEM of at least 3 biological replicates. *P < 0.05, **P < 0.01, ***P < 0.001, NA not applicable.

