Figure 2.
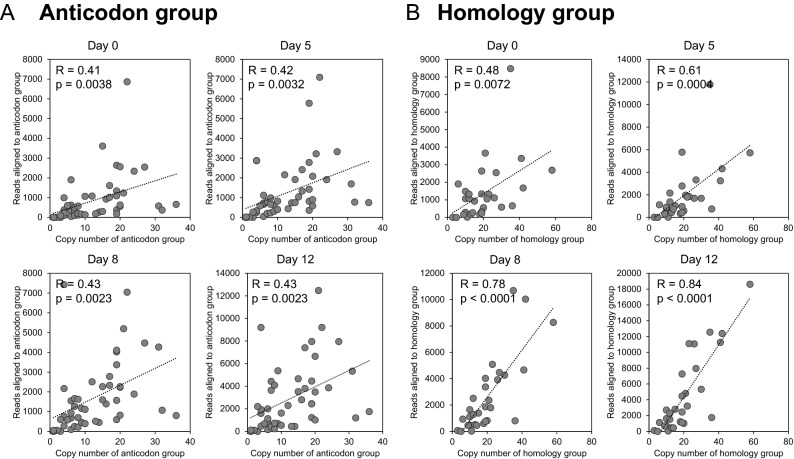
Correlation between tRF abundance and genomic copy number of homologous tRNA genes. For all four ages (days 0, 5, 8 and 12), tRF abundance and the tRNA gene copy number were compared with two different definitions for homologous tRNA gene groups. The copy number was determined based on the definitions of gene group. (A) Correlation based on anticodon. The number of sequence reads aligned to tRNA genes with a same anticodon (y-axis) is plotted against genomic frequency of the anticodon (x-axis). In this analysis, anticodon frequency represents the dosage of tRNA genes in each homologous group. (B) Correlation based on sequence homology among tRNA sequences. Unique tRNA sequences are binned into 30 homology groups. For each homology group, the genomic copy number (x-axis) and the number of sequencing read alignment to the homologous genomic copies (y-axis) are plotted. For each scatter plot, dotted line indicates linear regression, and the Pearson correlation (R) is provided with the significance (p).

