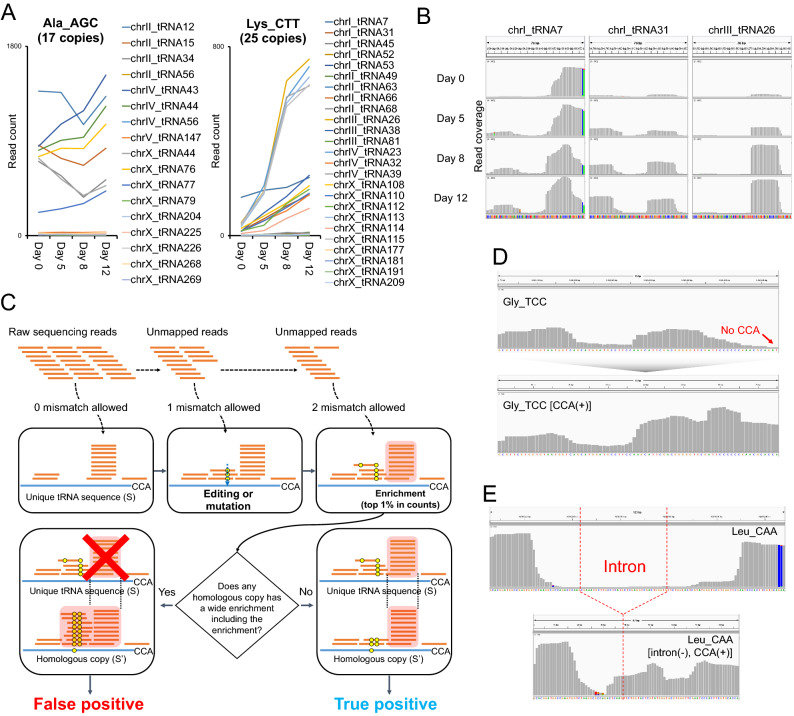
Figure 3.
Improved tRF identification using unique mature tRNA sequences. (A) Non-correlative quantitative changes among reads mapped to identical gene copies. For identical gene copies of Ala_AGC tRNA (17 copies) and Lys_CTT tRNA (25 copies), count of reads mapped to each individual gene is shown. (B) Different enrichment patterns and quantitative changes of reads mapped to identical gene copies. For three of 25 identical Lys_CTT tRNA gene copies, per-base read coverage is shown. Grey bars indicate sequenced bases matching the reference, and colored bars indicate mismatches. Green, brown, blue and red colors indicate adenine, guanine, cytosine, and thymine, respectively. The scale of y-axis is shown at the top left of each plot. (C) Schematic illustration of new sequence alignment strategy. Using 178 unique tRNA sequences as reference, a series of sequence alignments are performed with allowing zero, one, and then two mismatches. The process detects gene mutation or RNA base editing among homologous gene copies. For the enrichment, of which the abundance is among the top 1%, additional filtering is performed. Only when an enrichment exists as is in all homologous gene copies, the process determines true positive hits. (D,E) Comparison between previous and new alignment results. Per-base read coverage is compared between a tRNA gene and the sequence of matured tRNA (i.e., with 3′-CCA or without intron sequences). Grey bars indicate sequenced bases matching the reference, and colored bars indicate mismatches. Green, brown, blue and red colors indicate adenine, guanine, cytosine, and thymine, respectively.

