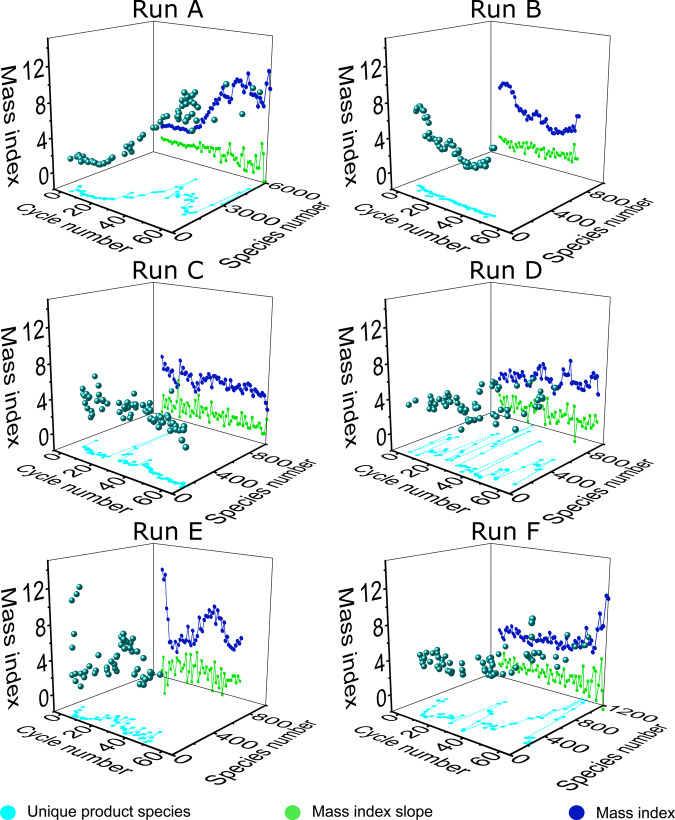
Fig. 4. Selected experiments, which reached 65 cycles or more.
The light-blue line represents the number of unique product species versus the number of cycles, while the dark-blue line represents the calculated Mass Index for each respective cycle. The green line shows the corresponding slope of the Mass Index values. The spherical data points map these in 3D. Run A, B, C, and D had a cycle time of 6 h, while E and F had 3 h per cycle.

