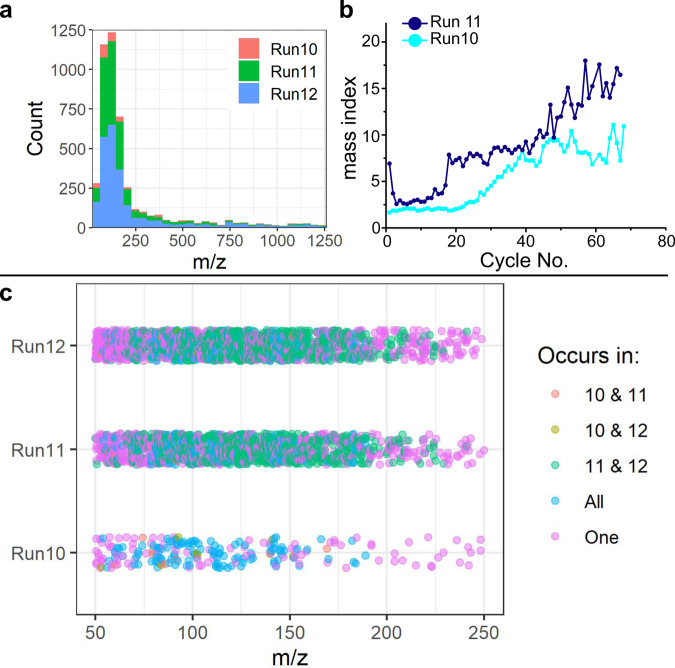
Fig. 5. Comparison of reproduced identical experiments.
a Shows the m/z value distribution of individual experiments analyzed with the Thermo Orbitrap Fusion Lumos. Run 10 (green), Run 11(blue), and Run 12 (purple) are compared with all ions appearing in total in all samples after thresholding. The graph on the right (b) shows the online analytical result on the Advion L-CMS series of Run 10 and Run 11. The online analytical system failed at Run 12, which is the reason that there is not a third comparable dataset. c It shows a comparison of the offline analytical data of all three runs. The measurements of run 11 and 12 were performed at the same time, while run 10 was measured at a later date. This means that the differences between run 10 and the other runs may be partially due to a difference in performance.

