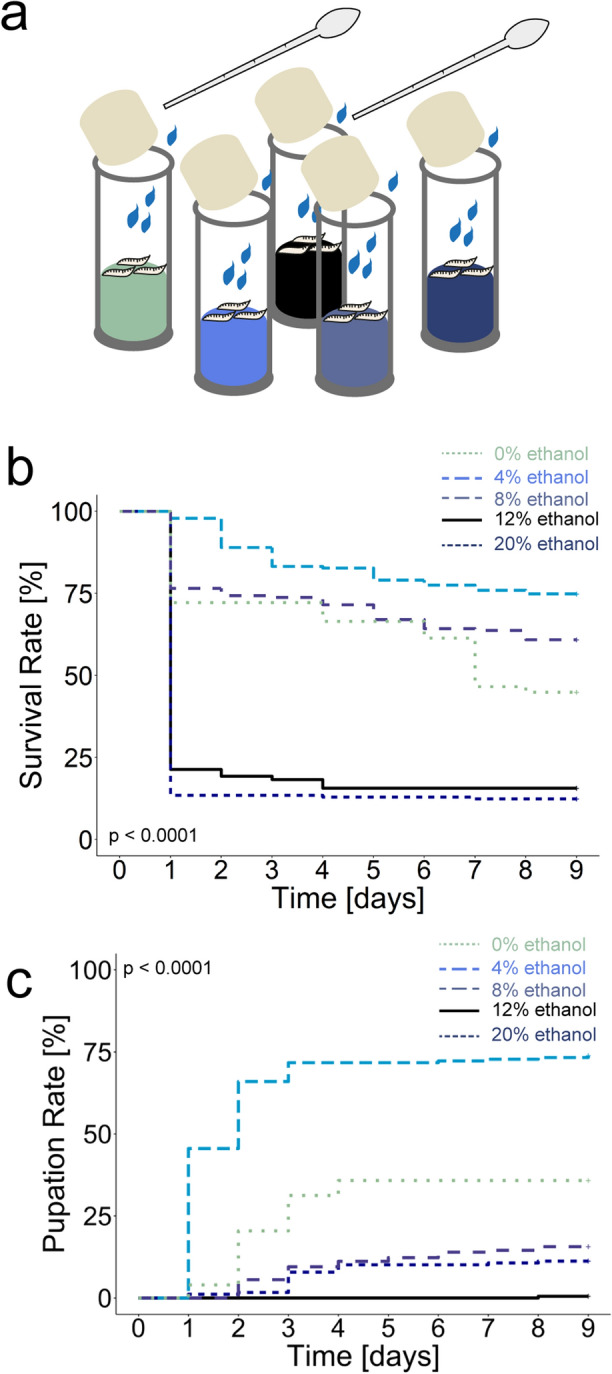
Figure 3.

Larval survival on diets containing different concentrations of ethanol. (a) Scheme of the experimental procedure. Independent groups of 12 second instar Canton-S larvae were put into food vials that contained an agarose substrate plus different concentration of ethanol. Surviving of larvae and pupae were counted every 24 h. Water was added every 24 h to avoid dehydration. Pupation was used as measure of survival. (b) Diagram shows Kaplan–Meier survival curves of larvae. Larvae were put either on 0% (green), 4% (light blue), 8% (blue), 12% (black), or 20% ethanol (dark blue) diet for eight days. 12% and 20% ethanol significantly reduced larval survival as most of the animals died within one day (survival rate12%Ethanol = 21.40%, survival rate20%Ethanol = 12.40%). Larvae reared on 0% and 8% ethanol showed a nearly similar survival (Log-Rank-test, p < 0.001, survival rate0%Ethanol = 44.90%, survival rate8%Ethanol = 60.90%). In contrast 4% ethanol diet significantly increased larval survival compared to the 0% ethanol control diet (Log-Rank-test, p < 0.001, survival rate4%Ethanol = 74.90%). (c) Diagram shows Kaplan–Meier survival curves of the related pupation rates of the surviving animals shown above raised at 0% (green), 4% (light blue), 8% (blue), 12% (black), or 20% ethanol (dark blue) diet. 4% ethanol diet significantly increased the pupation rate compared to larvae reared at 0% ethanol diet (Log-Rank-test, p < 0.001, pupation rate0%Ethanol = 35.8%, pupation rate4%Ethanol = 73.80%). In contrast 8%, 12%, and 20% ethanol diet significantly reduced the pupation rate compared to larvae reared at 0% ethanol diet (Log-Rank-test, p0%-8%Ethanol < 0.001, p0%-12%Ethanol < 0.001, p0%-20%Ethanol < 0.001, pupation rate8%Ethanol = 15.6%, pupation rate12%Ethanol = 0.5%, pupation rate20%Ethanol = 12.2%). Single scores and statistical tests underlying the different survival curves are documented in the Supplementary material. Sample size for each Kapplan-Meier survival curve is n = 16.
