Figure 4.
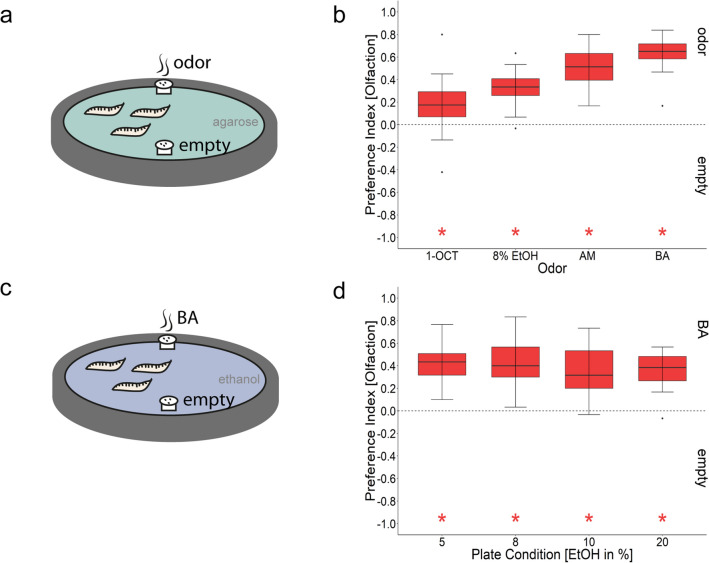
The effects of ethanol on larval olfactory attraction. (a) Scheme of the experimental procedure. The olfactory stimuli 1-OCT, AM, BA, and 8% ethanol were presented on a 2.5% agarose plate in custom made Teflon containers to prevent direct contact of the animals with the chemical. Larvae were allowed to crawl for 5 min. (b) Canton-S larvae preferred all odors including 8% ethanol over empty containers (n1-Octanol = 19, Pref1-Octanol = 0.17, ci = 0.04–0.29, nAM = 8, PrefAM = 0.51, ci = 0.3–0.69, n8%Ethanol = 16, Pref8%Ethanol = 0.33, ci = 0.24–0.41, nBA = 16, PrefBA = 0.65, ci = 0.55–0.72). All groups were significantly different to zero (one-sample t test, p1-octanol < 0.011, pAM < 0.001, p8%Ethanol < 0.001, pBA < 0.001). (c) Scheme of the experimental procedure. Test plates contained 2.5% agarose mixed with either 5%, 8%, 10%, or 20% ethanol. BA was presented in Teflon containers. Larvae were allowed to crawl for 5 min. (d) Canton-S larvae showed an olfactory preference for BA irrespective of the ethanol concentrations in the test plate. All groups were significantly different to zero (one-sample t test, pBA-5%Ethanol < 0.001, pBA-8%Ethanol < 0.001, pBA-10%Ethanol < 0.001, pBA-20%Ethanol < 0.001), but not different from each other (ANOVA, p < 0.697). Sample size for each box plot is n = 16. Differences against zero are indicated in red at the bottom of each panel. Significant differences of two groups are specifically indicated with an asterisk. Non-significant results are not indicated. Preference scores and statistical tests underlying the different indices are documented in the Supplementary material.

