Figure 5.

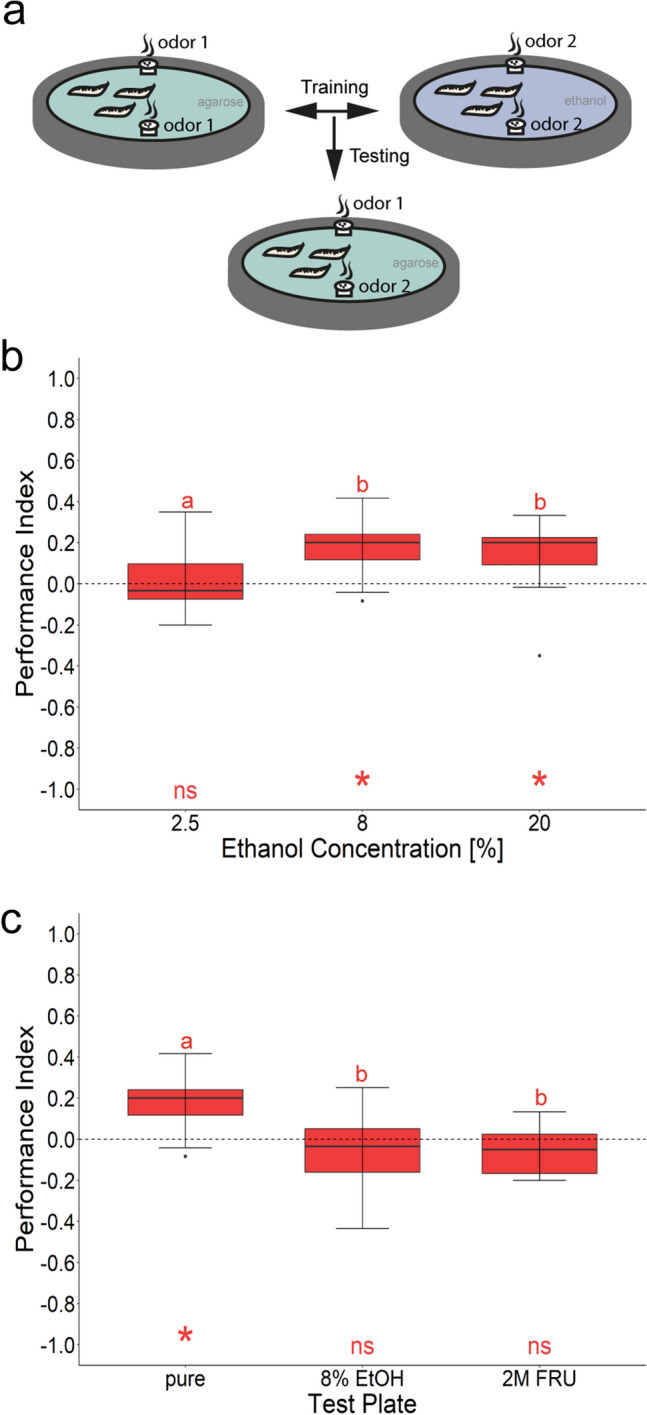
Larval olfactory learning reinforced by three different ethanol concentrations. (a) Scheme of the experimental procedure. Canton-S were trained three times with two odorants (AM and BA) and either 2.5%, 8%, or 20% ethanol as reinforcer. Olfactory memory is quantified by the performance index (PI). (b) Larvae trained with 8% and 20% ethanol concentration show a significant appetitive memory (PI8%Ethanol = 0.20, ci = 0.11–0.26, PI20%Ethanol = 0.20, ci = 0.05–0.24, one-sample t test, p8% < 0.001, p20% < 0.005). When 2.5% ethanol was used as a teaching signal no memory was detectable (PI2.5%Ethanol = 0.83, ci = − 0.07 to 0.08, one-sample t test, p2.5% < 0.828). Accordingly, larvae trained with 8% and 20% ethanol behaved differently from larvae trained with 2.5% ethanol (Dunn’s Multiple Comparison test, p < 0.001 and p < 0.003, respectively). (c) Larvae trained with 8% ethanol concentration as teaching signal and tested on control agarose showed a significant appetitive memory (PI = 0.20, ci = 0.11–0.26, one-sample t test, p < 0.001); if tested in the presence of the teaching signal of 8% ethanol or 2 M fructose (2 M FRU), appetitive associative memory is not expressed (PI8%Ethanol = − 0.03, ci = − 0.17 to 0.05, PI2MFru = − 0.05, ci = − 0.11 to 0.01) as it is not significantly different from zero (one-sample t test, p8%Ethanol < 0.260, p2MFru < 0.080) and not significantly different from each other (paired t-test, p < 0.902). Differences against zero are indicated in red at the bottom of each panel. Sample size for each box plot is n = 15. Significant differences between the groups are indicated with letters; Preference scores and statistical tests underlying the different indices are documented in the Supplementary material.
