Figure 1.
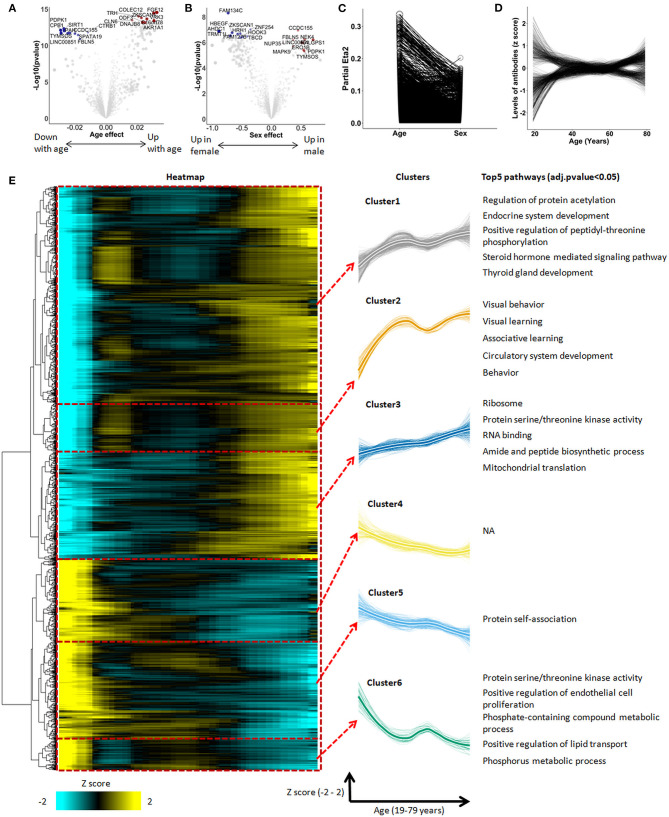
The autoimmunomic signature of aging identified by linear modeling. In total, serum levels of IgG autoantibodies against 9,256 human antigens were analyzed using linear models. Volcano plots representing changes of the autoimmunome with sex (A) and age (B). Dot sizes are proportional to the product of –log10(p-value) and sex or age effect (beta of the linear model). (C) Relative percentage of variance explained by age and sex, where partial Eta2 is calculated for age and sex. Values for each autoantibodies are connected by edges. (D) Autoantibody trajectories during aging. Levels of 1,276 aging-associated IgG autoantibodies were z-scored and trajectories of the autoantibodies were estimated by LOESS. (E) Heatmap and unsupervised hierarchical clustering of trajectories of the 1,276 aging-associated autoantibodies. The heatmap was used to group autoantibodies with similar trajectories. The right panel shows the 6 clusters, with thicker lines representing the average trajectory for each cluster. The top 5 significantly enriched pathways are represented for each cluster. Pathway enrichment was tested using GO and KEGG databases.

